


KEYTAKEAWAYS
- Liquidation heatmaps highlight areas with dense leverage, allowing traders to predict where mass liquidations may occur and avoid getting caught in volatility.
- Liquidation charts visualize past forced liquidations, helping traders identify weak support or strong resistance zones and gauge directional market sentiment.
- Platforms like Coinglass and CoinAnk offer actionable heatmap tools that enhance risk management and provide insights into market pressure and trader behavior.
CONTENT
Learn how liquidation heatmaps and charts help crypto traders identify risk zones, predict market moves, and avoid forced liquidations during volatile conditions.
WHAT IS LIQUIDATION?
In the world of crypto derivatives, liquidation refers to the forced closure of your leveraged position when your account balance is no longer sufficient to maintain it. This usually happens during extreme market volatility, where price movements quickly eat into your margin. If you fail to top up your collateral after receiving a margin call, the exchange will automatically liquidate your position to prevent further losses.
✏️ Put simply: “your position gets sold before you can even blink.”
When liquidation kicks in, the exchange sells off your assets at the current market price, and yes—it charges a liquidation fee on top of your losses. If there’s any collateral left after the position is closed, it will be returned to your account. But in fast-moving markets, don’t be surprised if there’s not much left. The final exit price may also be worse than expected due to slippage, meaning your actual liquidation price could end up far below the trigger level.
This is why understanding liquidation risk is critical for any trader using leverage.
To help manage this risk, many traders rely on tools like liquidation data charts or liquidation heatmaps—yes, that’s Heatmap—which visually highlight areas where large clusters of leveraged positions are likely to be liquidated. These tools give you insight into where the crowd might get wiped out, helping you avoid becoming part of the herd.
>>> More to read: What Does Crypto Liquidation Mean? A Beginner’s Guide
WHAT IS LIQUIDATION HEATMAP?
A Liquidation Heatmap is a visual representation of where leveraged positions are concentrated in the market. It highlights specific price zones that are loaded with high-risk long or short positions. When the market price reaches these zones, it can trigger a liquidation cascade—a chain reaction of forced sell-offs that often leads to sharp and sudden price moves.
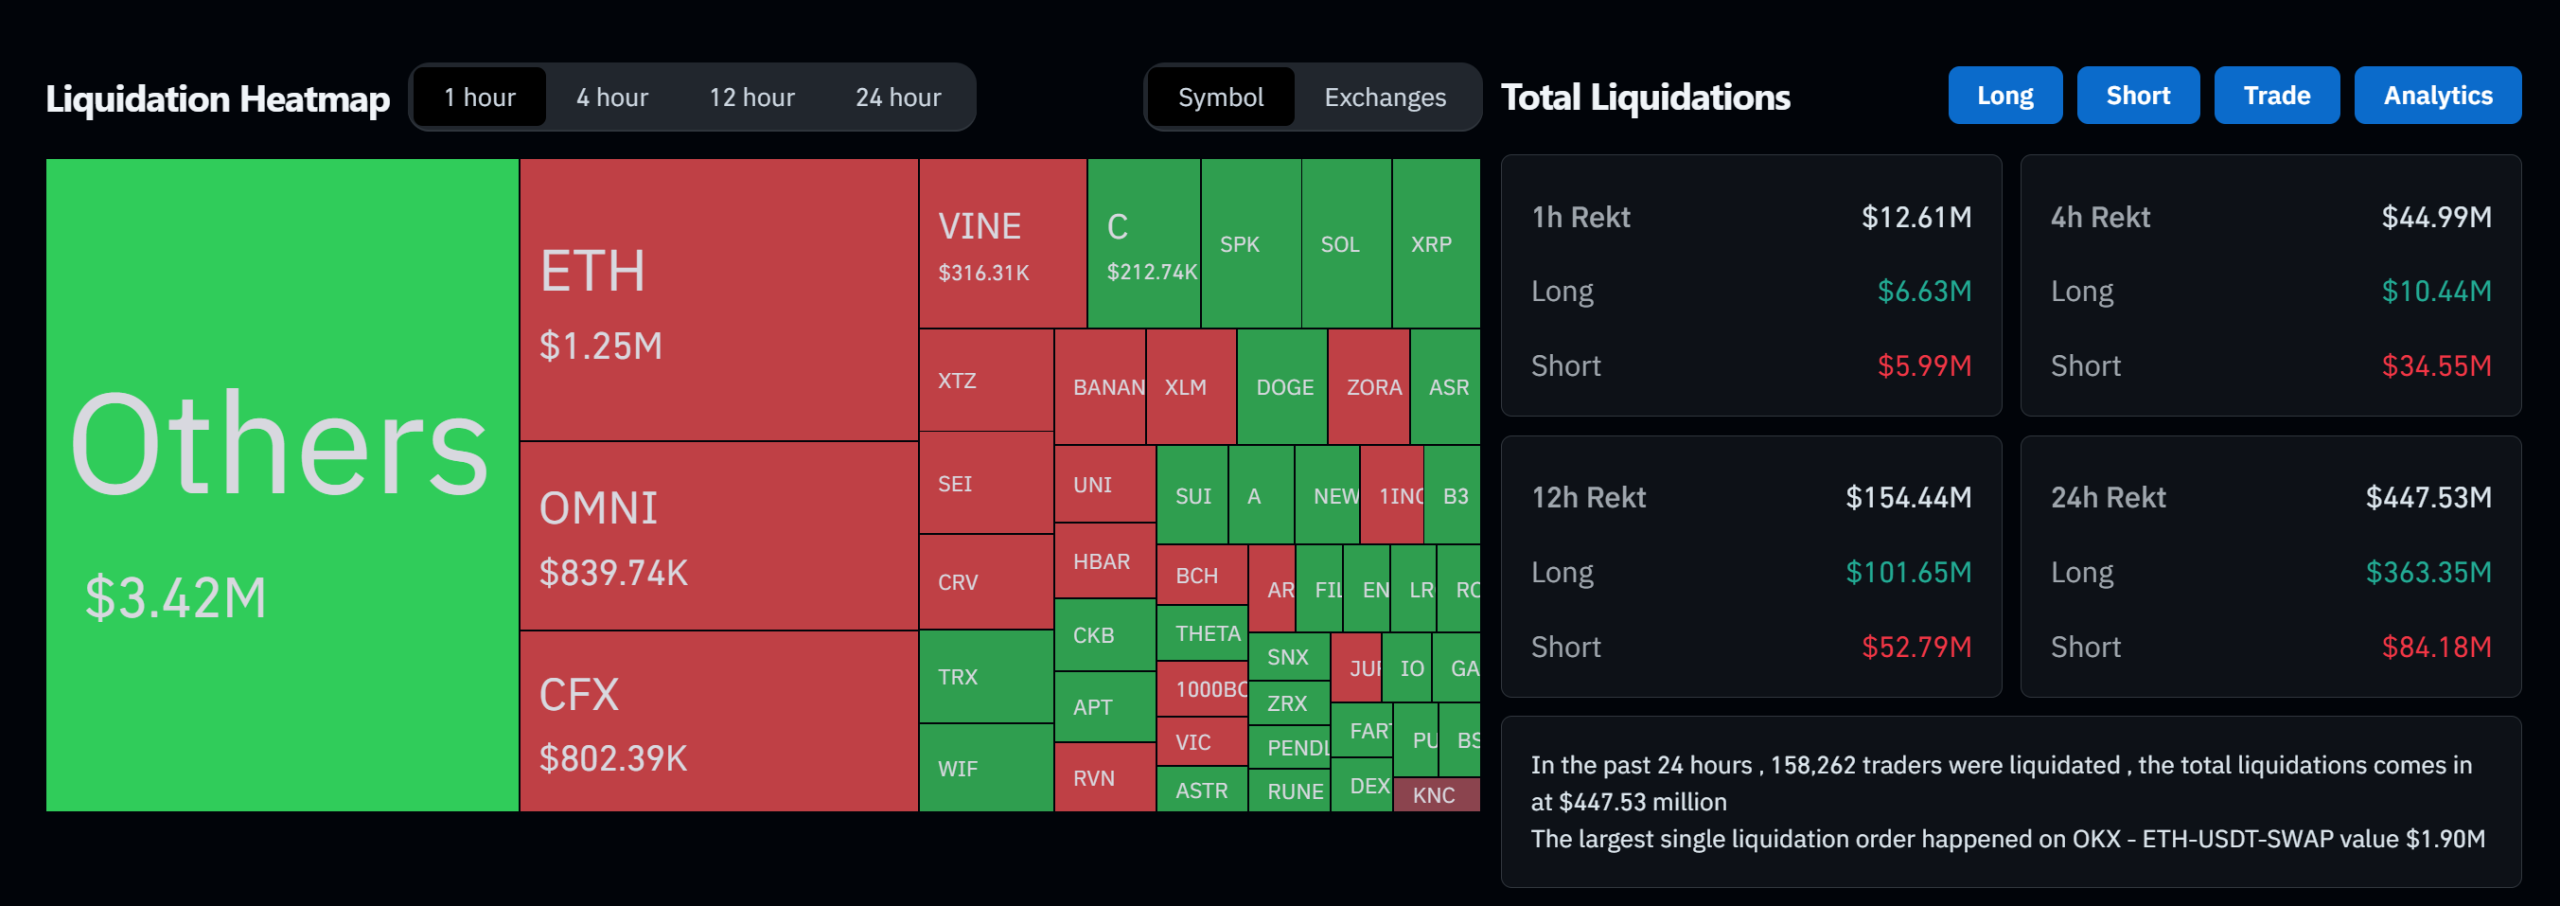
By analyzing the Heatmap, traders can anticipate where mass liquidations might occur and adjust their strategy accordingly.
📌 How to Read a Liquidation Heatmap
- Darker colors (red or orange): Indicate dense clusters of leveraged positions at that price level—high risk, high potential for a liquidation wave.
- Lighter colors (yellow or green): Fewer positions; less impact on the market if price enters these zones.
If price action approaches an area with concentrated leverage, the market may deliberately push toward that zone to trigger liquidations—often resulting in increased volatility.
📌 Trading Strategies Using the Liquidation Heatmap
- Predicting Volatility Zones
- If there’s a large concentration of leveraged positions around 85,000 USDT, and the price falls below that level, it could trigger a liquidation cascade and accelerate the downtrend.
- On the other hand, if price approaches that zone but holds, it may act as a strong support level, potentially leading to a bounce.
- Avoiding High-Risk Zones
- Say you plan to enter a long position, but notice a heavy concentration of longs around 95,000 USDT. That area could be a prime target for market manipulation—where price is intentionally driven down to liquidate those positions before bouncing.
- In such cases, it’s smarter to wait. Let the market flush out those weak hands first, then enter your trade with better odds.
Liquidation Heatmaps are not just fancy visuals—they’re actionable data tools. For leverage traders, they provide a critical edge in identifying risk zones, timing entries, and avoiding forced exits.
>>> More to read: Understanding Leverage in Crypto Market
WHAT IS LIQUIDATION CHART?
A Liquidation Chart is a visual tool that displays historical liquidation events across specific time intervals. Unlike a Heatmap, which highlights potential liquidation zones based on open leveraged positions, the Liquidation Chart focuses on what has already happened—helping traders analyze past leverage dynamics and understand market pressure points.
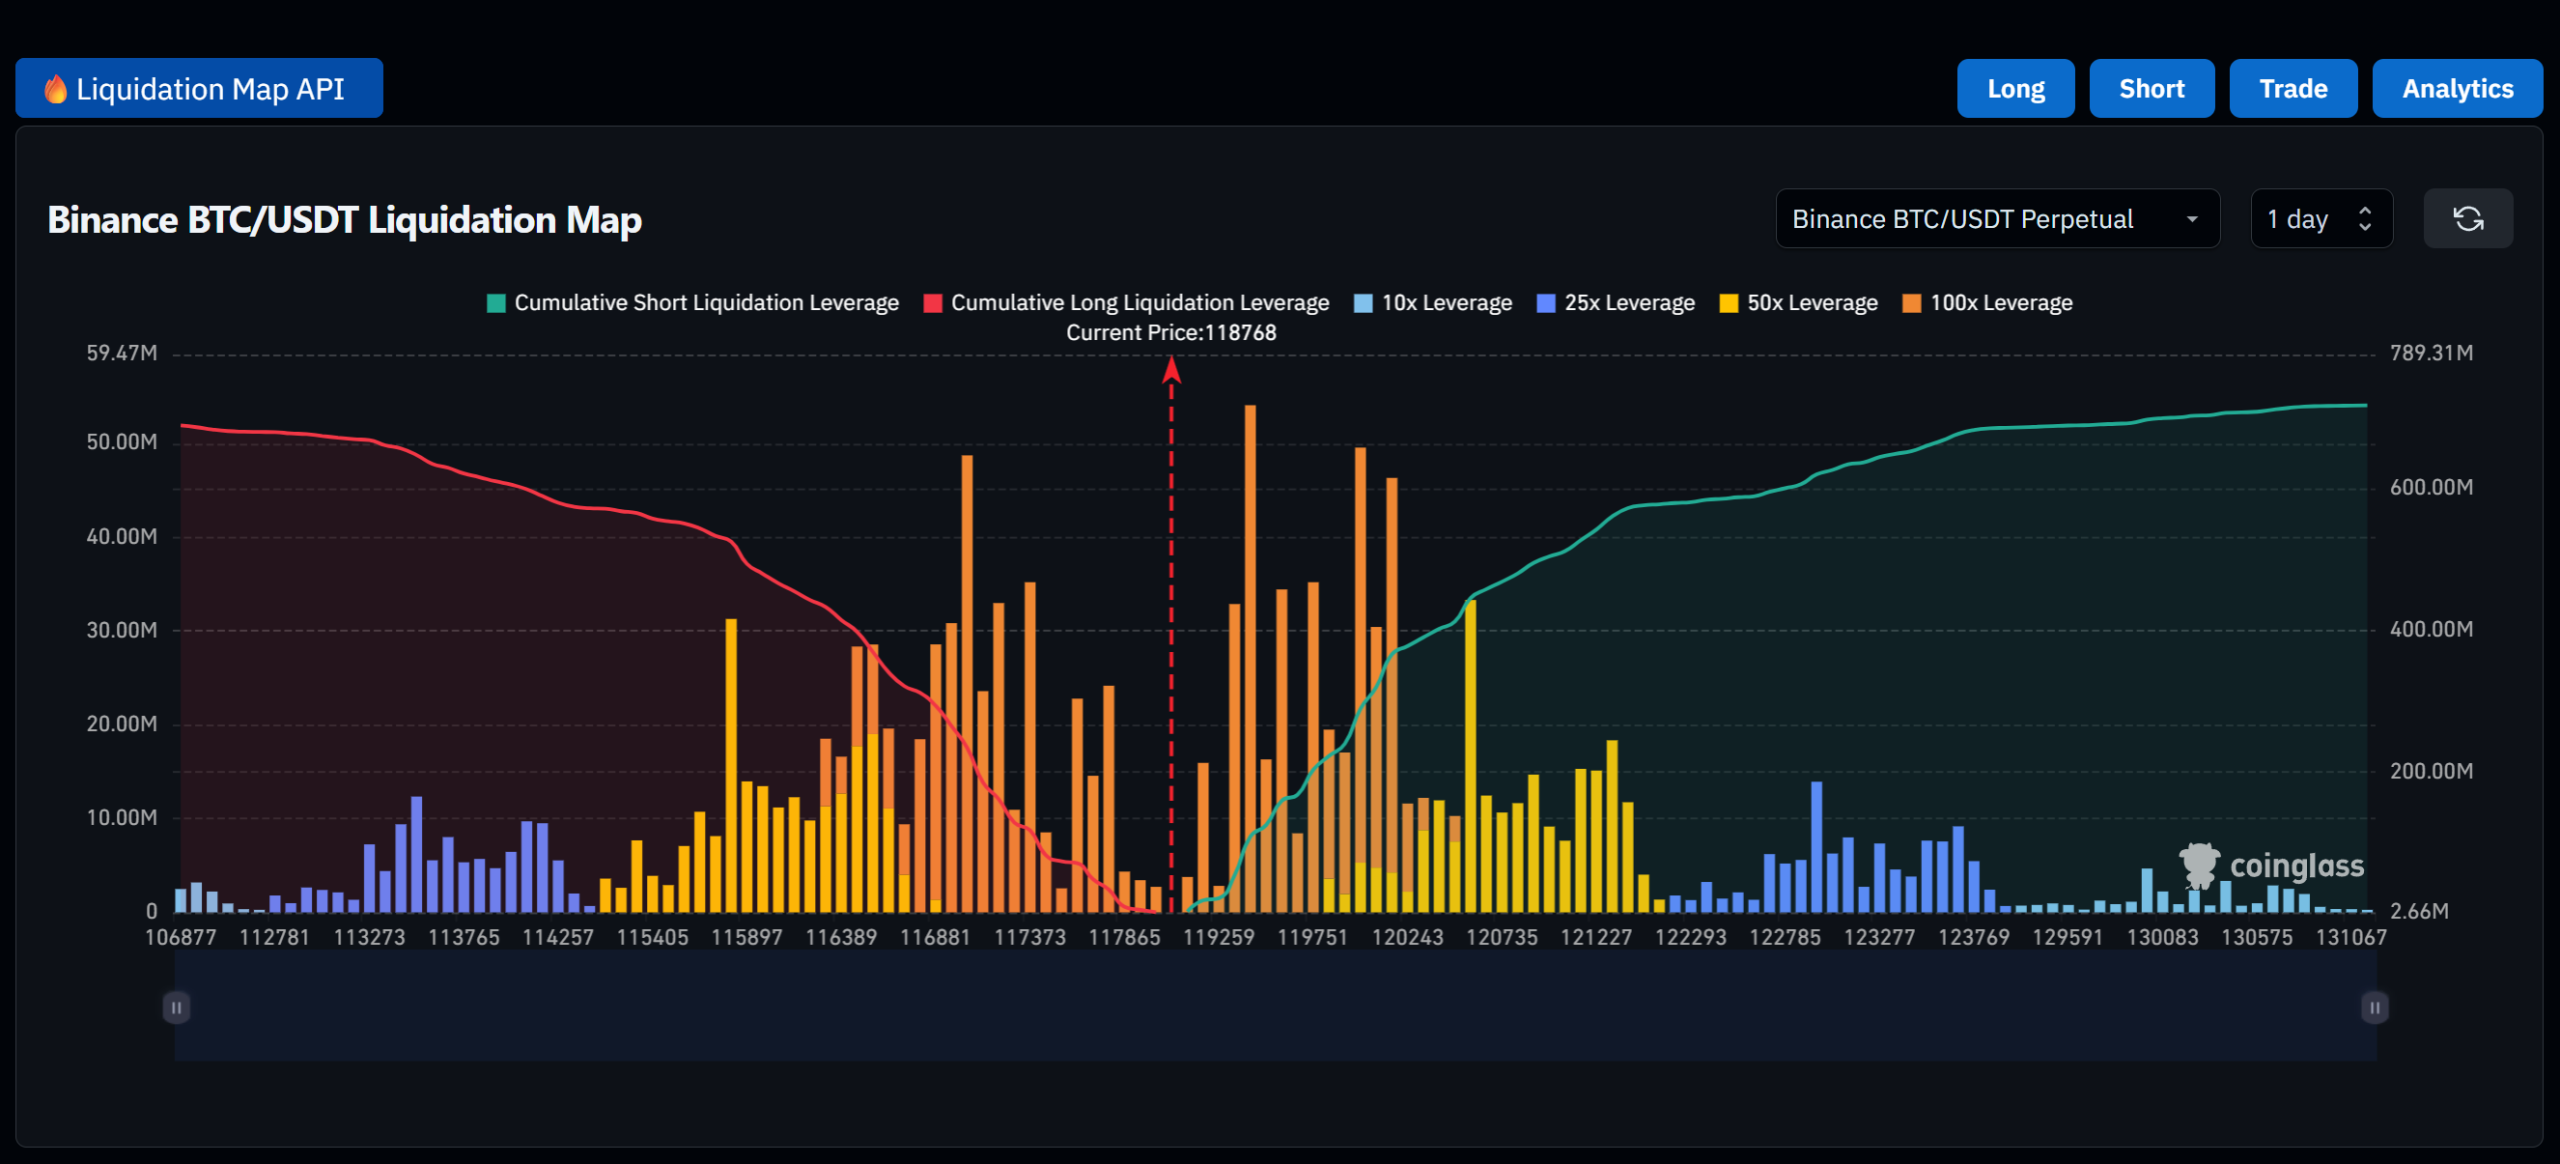
By reviewing liquidation data over time, traders can identify support and resistance zones, market sentiment shifts, and momentum strength.
✅ How to Read a Liquidation Chart
- Bar Chart Format: Each vertical bar represents the total liquidations within a given time period. The taller the bar, the larger the volume of forced liquidations during that interval.
-
Color Coding:
- Red bars indicate long positions were liquidated, often coinciding with price drops.
-
Green bars reflect short liquidations, typically occurring during price rallies.
This color-coded structure allows traders to quickly interpret directional pressure and market aggression.
✅ How to Use a Liquidation Chart in Trading
- Identify Key Support and Resistance Levels
- If a large number of long positions were liquidated near 90,000 USDT, it suggests that price level acted as a weak support. If price revisits that zone, it may face renewed selling pressure.
- Conversely, if significant short liquidations occurred around 100,000 USDT, it likely marked a strong resistance area. A clean breakout beyond that point could lead to further upside momentum.
- Confirm or Question Market Momentum
- If the price continues to fall but liquidation volume remains low, it might indicate that bearish momentum is weakening—raising the chance of a bounce.
- If the price is steadily rising without triggering many short liquidations, it suggests a healthy uptrend with minimal resistance from over-leveraged shorts.
Liquidation Chart gives you a look at where the market has already punished leveraged traders, while the Heatmap helps you anticipate where it might strike next. Using both tools in tandem gives you deeper insights into leverage behavior—so you can avoid being on the wrong side of a liquidation spike.
>>> More to read: How to Hedge Crypto? Key Concepts You Should Know
WHERE TO VIEW LIQUIDATION DATA & HEATMAPS?
If you’re trading with leverage, understanding where liquidation risks are concentrated can give you a major edge. A Liquidation Heatmap is an essential tool for visualizing clusters of potential liquidations—helping you anticipate price reactions and avoid getting caught in a liquidation cascade.
Here are two well-known platforms that offer reliable Heatmap services:
1. Coinglass
Coinglass provides comprehensive liquidation data for Bitcoin and other major cryptocurrencies. Its Heatmap feature allows users to view potential liquidation zones across different leverage ratios. This makes it easier to identify high-risk price areas and plan smarter entry or exit points.
2. CoinAnk
CoinAnk focuses on delivering highly visual Liquidation Heatmaps. These charts use color intensity to show the strength and density of liquidation clusters, giving traders a fast and intuitive way to assess pressure zones and spot likely targets for price moves.
🔍 Summary
For any serious crypto derivatives trader, tools like these are more than just nice-to-haves—they’re core components of an informed risk management strategy. A well-read Heatmap not only protects your capital but also helps you better understand market sentiment and whale behavior.