


KEYTAKEAWAYS
-
Crypto market cap calculator is a valuation tool, not a price prediction tool.
In a post narrative market, market capitalization functions as a constraint rather than a source of upside imagination. Using a crypto market cap calculator helps investors identify how much growth, adoption, and capital inflow are already implied in current prices, instead of relying on unit price or short term momentum.
-
The gap between circulating market cap and FDV defines long term risk exposure.
Projects with low circulating supply and high fully diluted valuation embed future sell pressure into their valuation structure. Historical cycles show that these supply dynamics matter more than narratives once liquidity tightens and token unlocks accelerate.
-
Market cap must be evaluated alongside onchain usage to remain meaningful.
Market capitalization without transaction activity, user growth, or protocol usage is incomplete. When market cap growth consistently outpaces onchain adoption, valuation becomes fragile and more vulnerable during post narrative repricing phases.
- KEY TAKEAWAYS
- WHY MARKET CAP BECOMES THE PRIMARY ANCHOR AFTER NARRATIVES FADE
- USING A CRYPTO MARKET CAP CALCULATOR TO ANALYZE SUPPLY STRUCTURE
- CONNECTING MARKET CAP WITH ONCHAIN USAGE DATA
- MARKET CAP COMPARISONS AND RISK PRICING IN A MATURE MARKET
- HOW CRYPTO VALUATION HOLDS UP WHEN EXPECTATIONS RESET
- DISCLAIMER
- WRITER’S INTRO
CONTENT
For much of the last cycle crypto prices were driven by narrative velocity rather than valuation discipline. Liquidity was abundant and market participants rewarded growth projections even when usage data lagged. As narratives weaken and capital becomes selective valuation frameworks are no longer optional. They are necessary.
This shift has elevated one concept back to the center of analysis. Market capitalization. More specifically how investors use a crypto market cap calculator to translate price speculation into structural constraints. In the current market environment valuation is not about predicting upside. It is about identifying which assumptions are already priced in and whether those assumptions can realistically be sustained.
WHY MARKET CAP BECOMES THE PRIMARY ANCHOR AFTER NARRATIVES FADE
Market cap as a measurable boundary rather than a speculative signal
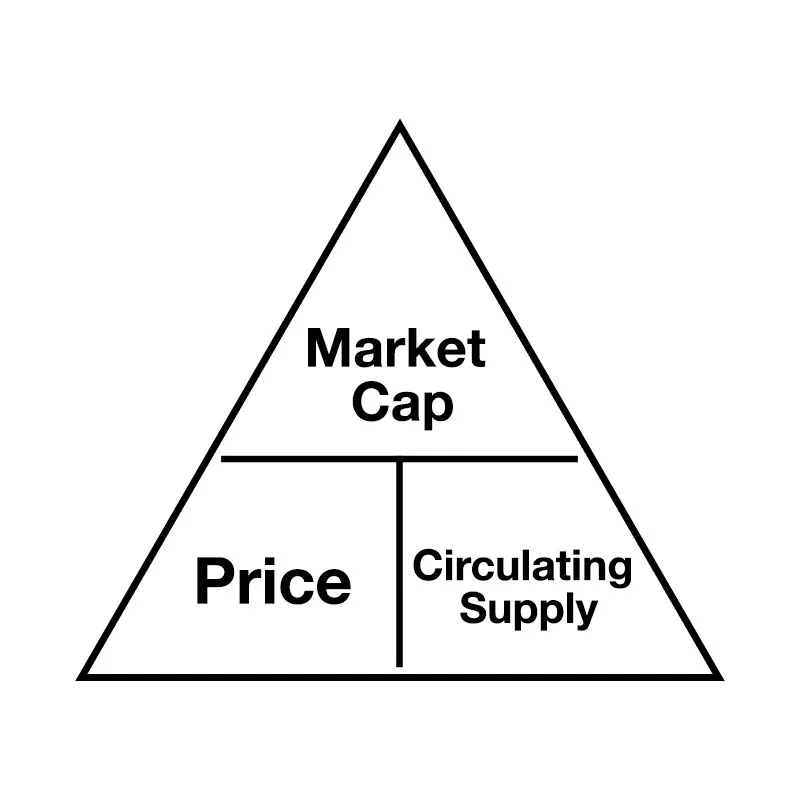
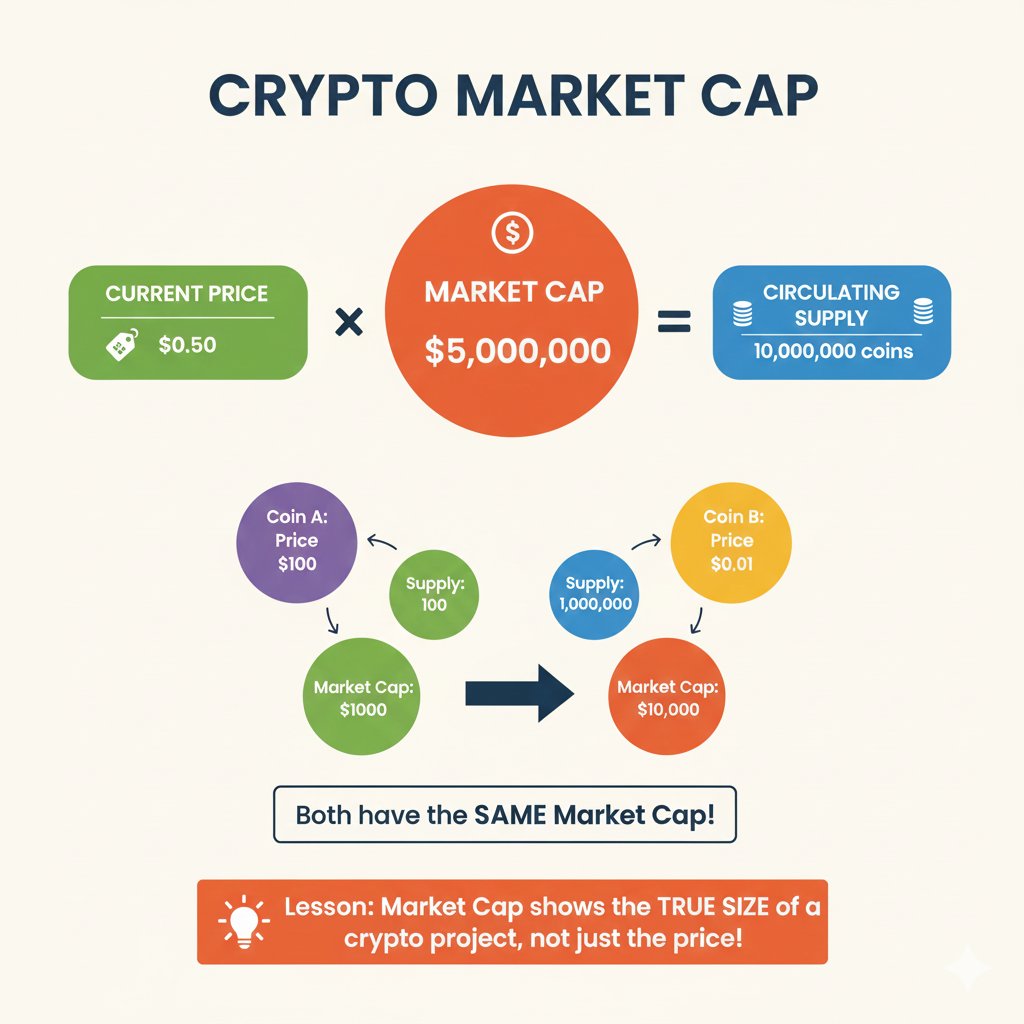
In crypto markets price is often mistaken for value. Tokens with low unit prices are frequently perceived as undervalued while higher priced assets are viewed as expensive. This perception ignores supply structure and leads to distorted expectations. Market capitalization corrects this bias by forcing price to interact with circulating supply.
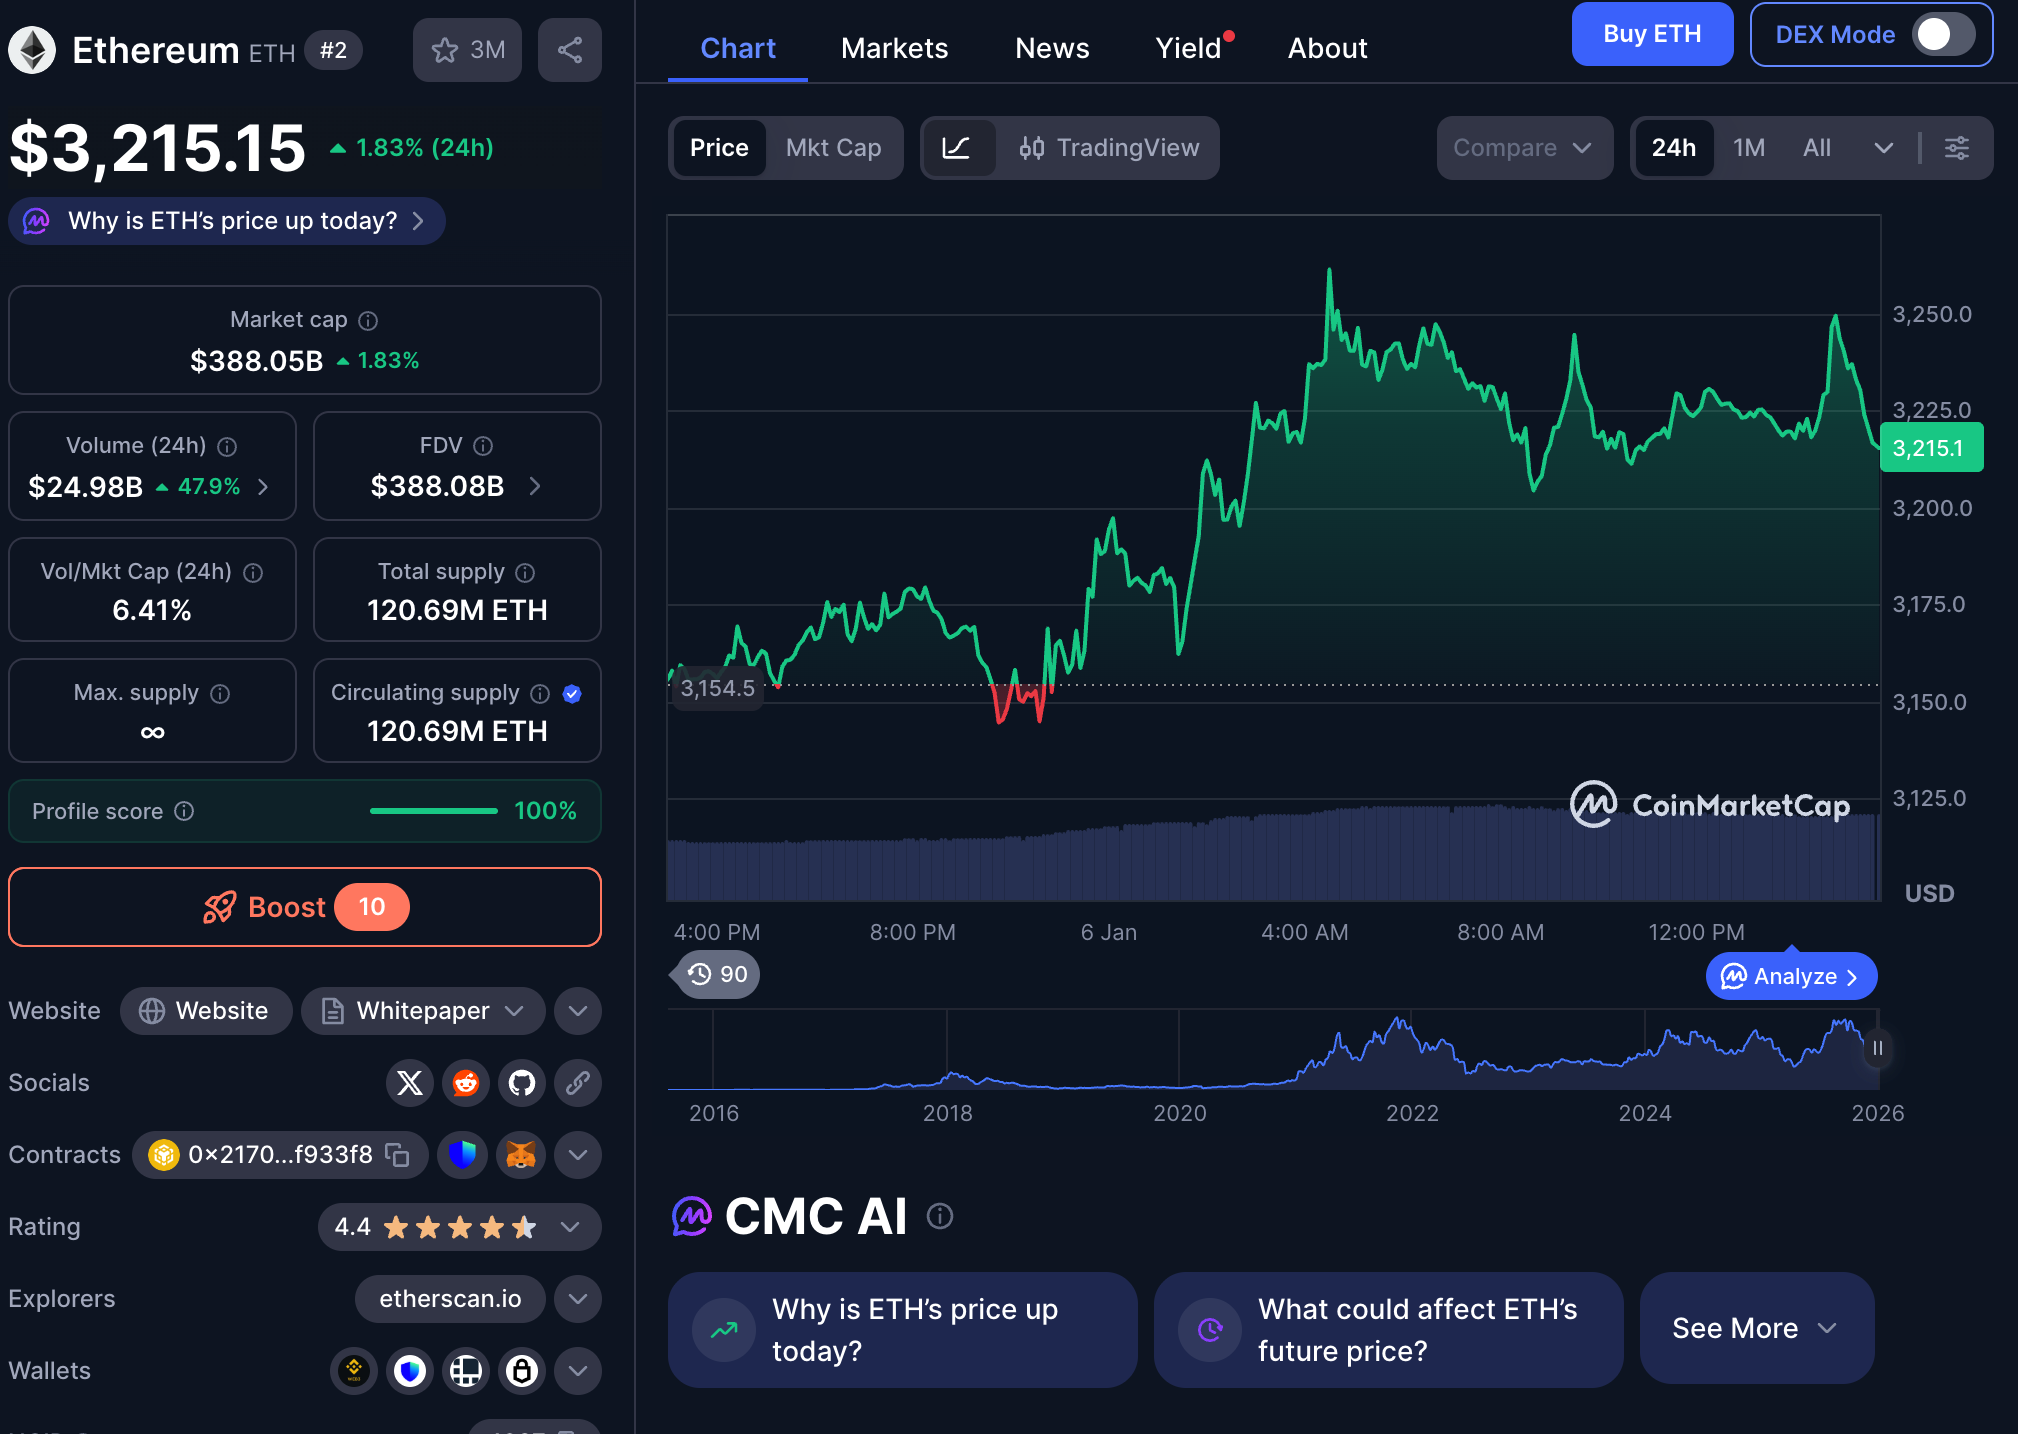
A crypto market cap calculator makes this interaction explicit. It shows how much capital the market has collectively assigned to a network at a given point in time. This is not an abstract metric. It is the aggregated outcome of all buy and sell decisions across exchanges.
Historically assets with sustained high market capitalization such as Bitcoin and Ethereum have earned that position through long term security liquidity and network adoption. Their market caps are not projections. They are reflections of capital already committed.
In post narrative phases market cap functions as a boundary. It defines how much additional belief the market must absorb to justify further upside. When expectations exceed what usage and supply dynamics can support valuation collapses toward this boundary.
How market cap reveals embedded assumptions in price
Every market cap implies a set of assumptions. Assumptions about adoption growth user retention fee generation or settlement demand. These assumptions are often implicit and rarely stated explicitly.
Using a crypto market cap calculator allows investors to reverse engineer those assumptions. If a protocol trades at a ten billion dollar market cap while serving a small user base the implied growth requirements are extreme. The calculator does not judge whether growth is possible. It clarifies how much growth is required.
This is particularly important in periods of declining narrative momentum. When liquidity tightens the market becomes less forgiving of optimistic projections. Assets whose market caps embed aggressive assumptions without corresponding data tend to reprice quickly.
Market cap therefore acts as a diagnostic tool. It exposes the distance between current valuation and observable fundamentals. In mature market conditions that distance matters more than vision statements or roadmap promises.
USING A CRYPTO MARKET CAP CALCULATOR TO ANALYZE SUPPLY STRUCTURE
Circulating market cap and the reality of tradable supply
Circulating market cap reflects the value of tokens that are currently available for trading. It is calculated by multiplying price by circulating supply. This metric matters because only circulating tokens can exert immediate market pressure.
A crypto market cap calculator helps distinguish between theoretical value and tradable value. Projects with small circulating supplies can appear scarce while large portions of their supply remain locked. This creates an illusion of limited supply that disappears as unlocks begin.
Historically many VC backed projects entered the market with less than twenty percent of tokens circulating. As unlock schedules progressed prices often struggled regardless of development progress. The reason was not lack of innovation but sustained sell pressure from newly unlocked supply.
Circulating market cap captures present conditions. It tells investors how much capital is currently exposed to market forces. Ignoring it leads to underestimating dilution risk especially in multi year vesting structures.
Fully diluted valuation as a forward looking stress test
Fully diluted valuation assumes that all tokens will eventually enter circulation at the current price. This is not a prediction. It is a stress scenario.
Using a crypto market cap calculator to examine FDV forces a simple question. Can the market realistically absorb the full supply at this valuation. If the answer depends on exponential growth that has not yet materialized risk is elevated.
FDV has repeatedly proven to be a leading indicator of long term price pressure. Assets with extremely high FDV relative to usage often experience prolonged underperformance once unlocks accelerate.
FDV is not pessimistic. It is disciplined. It evaluates whether current prices assume future success that may already be fully priced in. In post narrative markets this distinction becomes critical.
CONNECTING MARKET CAP WITH ONCHAIN USAGE DATA
Why valuation must be measured against real network activity
Market cap alone does not determine whether an asset is overvalued or undervalued. It must be contextualized with usage data.
Across multiple cycles there have been periods where market caps expanded rapidly while onchain activity stagnated. These divergences consistently resolved through price corrections. Valuation moved ahead of adoption.
Onchain metrics such as transaction volume active addresses and protocol usage provide an objective counterbalance. When these metrics grow in line with market cap valuation expansion is more sustainable.
Data platforms like CoinMarketCap and CoinGecko increasingly integrate supply metrics and usage indicators for this reason. Market cap without context is incomplete.
When market cap growth outpaces adoption
A crypto market cap calculator highlights discrepancies between valuation and usage. When market cap growth far exceeds growth in users or activity assumptions become fragile.
These conditions often emerge during narrative driven rallies. Capital chases stories before infrastructure matures. Once attention fades valuation compresses toward actual usage levels.
Post narrative markets expose these imbalances quickly. Investors who rely on usage adjusted valuation are better positioned to avoid assets whose market caps require unrealistic adoption curves.
MARKET CAP COMPARISONS AND RISK PRICING IN A MATURE MARKET
Responsible market cap comparisons across similar stages
Market cap comparisons are widely used to estimate upside but are frequently misapplied. Comparing early stage projects to mature networks assumes compressed timelines that history does not support.
Effective comparisons must respect functional category and maturity. Infrastructure should be compared with infrastructure. Applications with applications. Even then differences in adoption trajectories matter.
A crypto market cap calculator helps frame these comparisons realistically. It shows not just potential upside but the scale of capital inflow required to achieve it.
Market cap tiers as implicit risk profiles
Different market cap ranges correspond to different risk regimes. Large cap assets tend to reflect macro allocation decisions. Mid cap assets embed growth expectations. Small cap assets are driven by liquidity and sentiment.
Understanding this distribution is central to portfolio construction. Market cap is not merely descriptive. It is a proxy for risk exposure.
In post narrative markets capital migrates toward assets with defensible market caps. Those with valuation structures unsupported by data tend to reprice fastest.
HOW CRYPTO VALUATION HOLDS UP WHEN EXPECTATIONS RESET
After narratives fade valuation becomes less forgiving. Market cap stops functioning as a leaderboard and begins acting as a constraint. Supply schedules usage data and comparative valuation matter more than storytelling.
A crypto market cap calculator does not predict the future. It clarifies the assumptions embedded in current prices. In a market defined by tighter liquidity and slower growth that clarity is no longer optional.
Projects that survive repricing cycles are not those with the loudest narratives but those whose market caps can withstand scrutiny when growth expectations normalize.