


KEYTAKEAWAYS
-
Financial Reports vs. Forecasts: Financial forecasts often hold greater significance than reports because the market always anticipates future performance.
-
Base Effect's Psychological Impact: Stock prices are influenced by psychological expectations, leading to unexpected trends despite varying financial results.
-
Tech Sector Highlights: AI, cloud computing, and evolving advertising strategies shape growth prospects and market sentiment for leading tech firms.
CONTENT
After the U.S. exciting earning season starting in mid-April, readers must have noticed the “huge influence” of financial reports on stock prices. Some companies released better-than-expected financial reports yet saw their stock prices fall, while others performed poorly but experienced substantial gains. Today, the author would like to summarize the financial performances of these tech giants for further reference, and share thoughts about the base effect.
Timeline and Financial Performance

TESLA

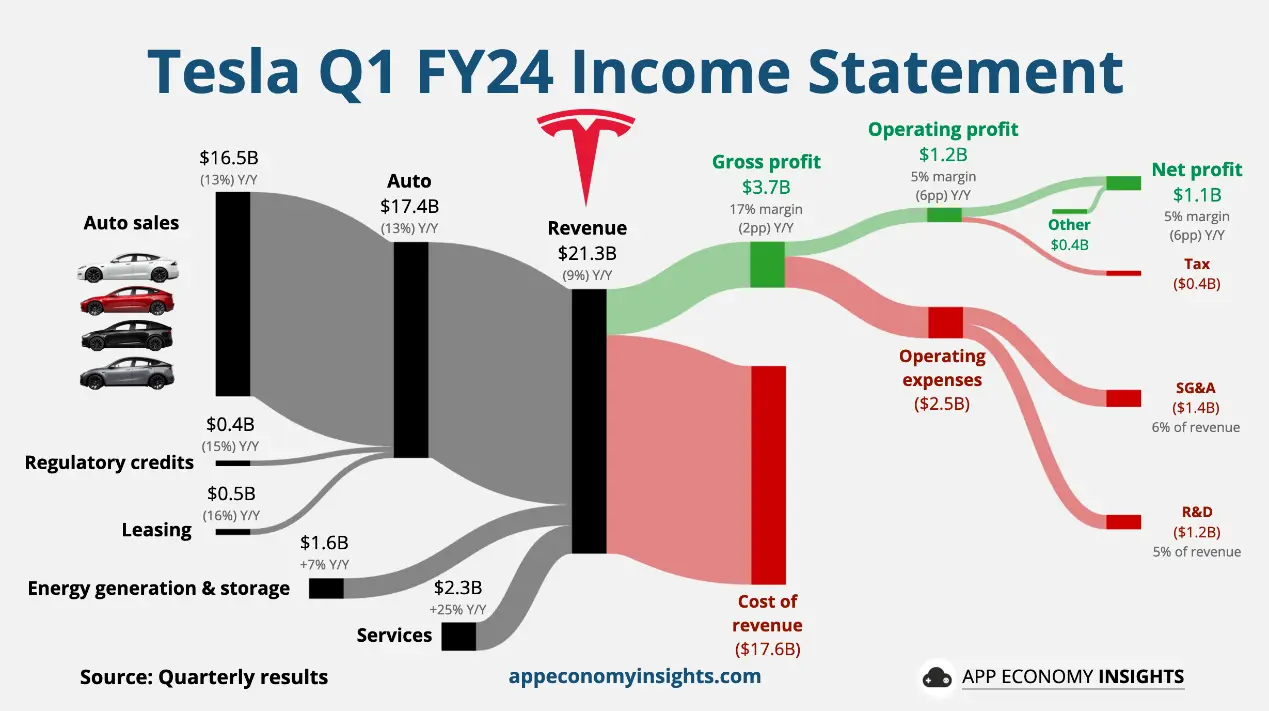
Mocked as the “garbage truck,” Tesla regained face after releasing its first-quarter financial report. Despite revenue and EPS both falling short of expectations and maintaining 2024 growth forecasts for production and delivery at “significantly lower” rates, Tesla’s management clarified that it hadn’t abandoned the idea of cheaper models. They emphasized that the “dedicated autonomous taxi” would be a revolutionary future product, dispelling rumors about scrapping Model 2 development for Robotaxi. Both are clear focuses for Tesla.
Source: App Economy Insights
From the financial report, Q1 results were indeed poor: revenue dropped by 9% year-over-year to $21.3 billion, below the $23.3 billion expected. This was the largest decline since 2012. However, the market seemed to have anticipated Tesla’s underperformance, as stock prices had already corrected rapidly earlier. With the global boom in EV research, EVs have been widely criticized. Seeing Tesla provide an outlook that aligns with market expectations is a positive sign.
Tesla Key Metrics

META
Source: App Economy Insights
Revenue and Profit:
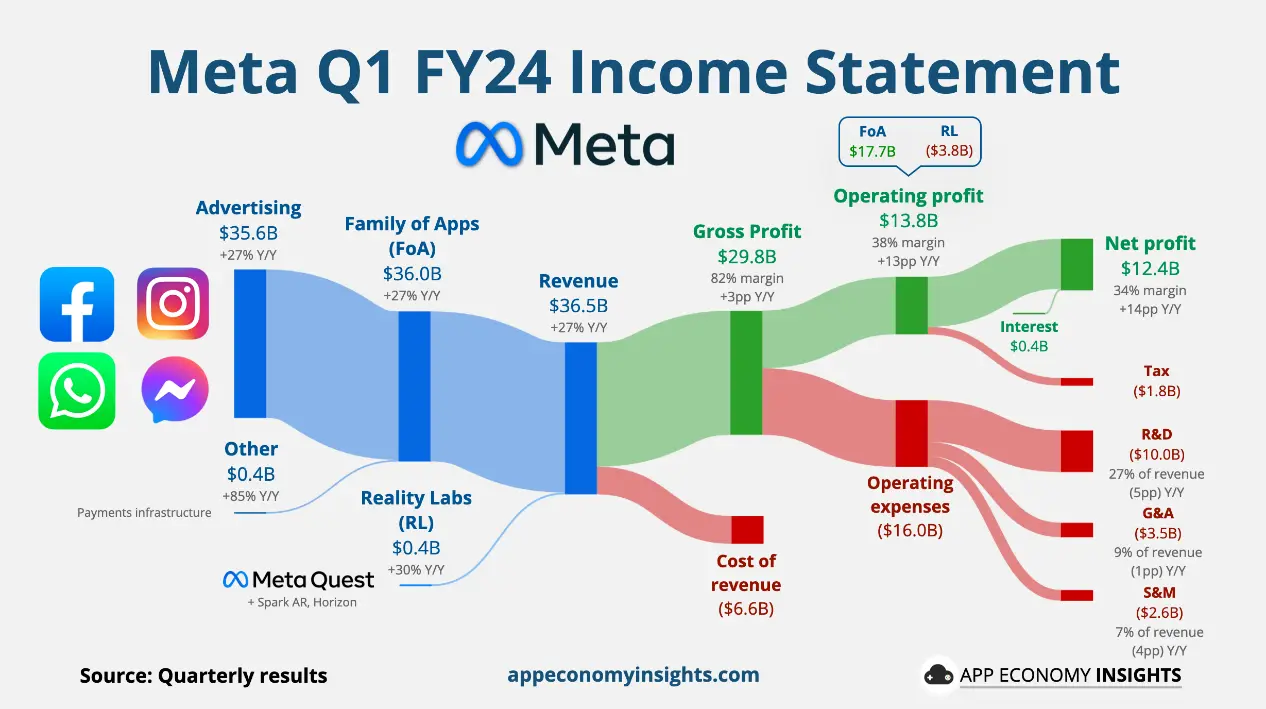
- Meta’s Q1 revenue and profit both exceeded expectations, with core advertising revenue growth accelerating.
- Revenue: $36.46 billion, up 27% year-over-year.
- EPS: $4.71 per share, higher than the expected $4.3.
- Operating Profit: Up 91% year-over-year to $13.82 billion.
Q2 Outlook:
- Expected Q2 revenue is between $36.5 billion and $39 billion, below market expectations.
- The Metaverse division reported a quarterly loss of nearly $3.9 billion.
Highlights and Risks:
- AI-driven advertising growth has increased the capital expenditure forecast.
- Despite the strong results, the stock price fell, raising concerns in the market.
Key Metrics:
- DAP grew by 7% year-over-year, and ad impressions increased by 20%.
- The average price per ad increased by 6%.
Major Initiatives and Investments:
- Reality Labs (Metaverse) continues to incur a quarterly loss of nearly $3.9 billion, although this is better than market expectations.
- The company reiterated its commitment to investing in AI, significantly raising the capital expenditure forecast.
Focus Points:
Investors will closely follow the details of AI and Metaverse development and how Meta plans to leverage these tools to improve advertising strategies and user engagement.
Market Sentiment:
Despite Meta’s stock price rising by nearly 40% this year, the financial report and forecast have been poorly received by the market, which is still concerned about the risks of slowing performance growth. Nevertheless, AI-driven advertising is set to be a significant growth driver for the company moving forward.
MICROSOFT
Source: App Economy Insights
Performance Highlights:
- Growth driven by AI exceeded expectations, and Microsoft’s overall performance was strong.
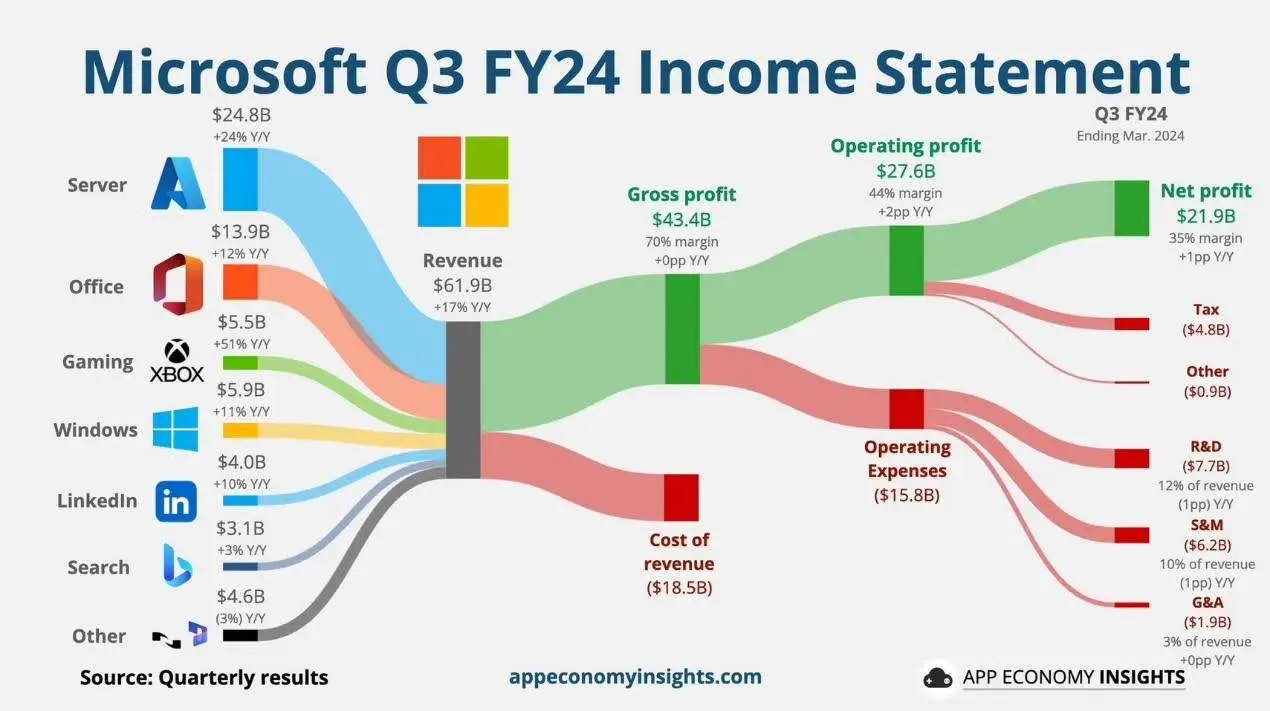
- Azure Cloud Revenue: Up 31% year-over-year, increasing the contribution margin by 7 percentage points to reach 21%, exceeding the company’s guidance of 18%.
- Total Revenue: $61.86 billion, up 17% year-over-year, surpassing market expectations.
- Adjusted EPS: $2.94, up 20% year-over-year.
- Cloud Revenue: Up 23% year-over-year, while operating profit increased by 23% (AI clearly propelled cloud services growth).
Business Unit Performance:
- Intelligent Cloud: Revenue grew 21% to $26.7 billion.
- Microsoft 365 Copilot: The generative AI tool boosted Office commercial revenue by 15%.
- More Personal Computing: Revenue increased 17% year-over-year to $15.6 billion.
Investor Focus:
- Investors are focused on the commercialization prospects of Microsoft’s AI and its impact on future growth (Microsoft invested $13 billion in OpenAI, and the returns seem promising).
Microsoft’s AI Strategy:
- Microsoft continues to expand its AI presence through strategic partnerships and investments, avoiding direct acquisitions.
- Microsoft has invested billions of dollars in several AI startups and has brought in multiple AI experts to join the company.
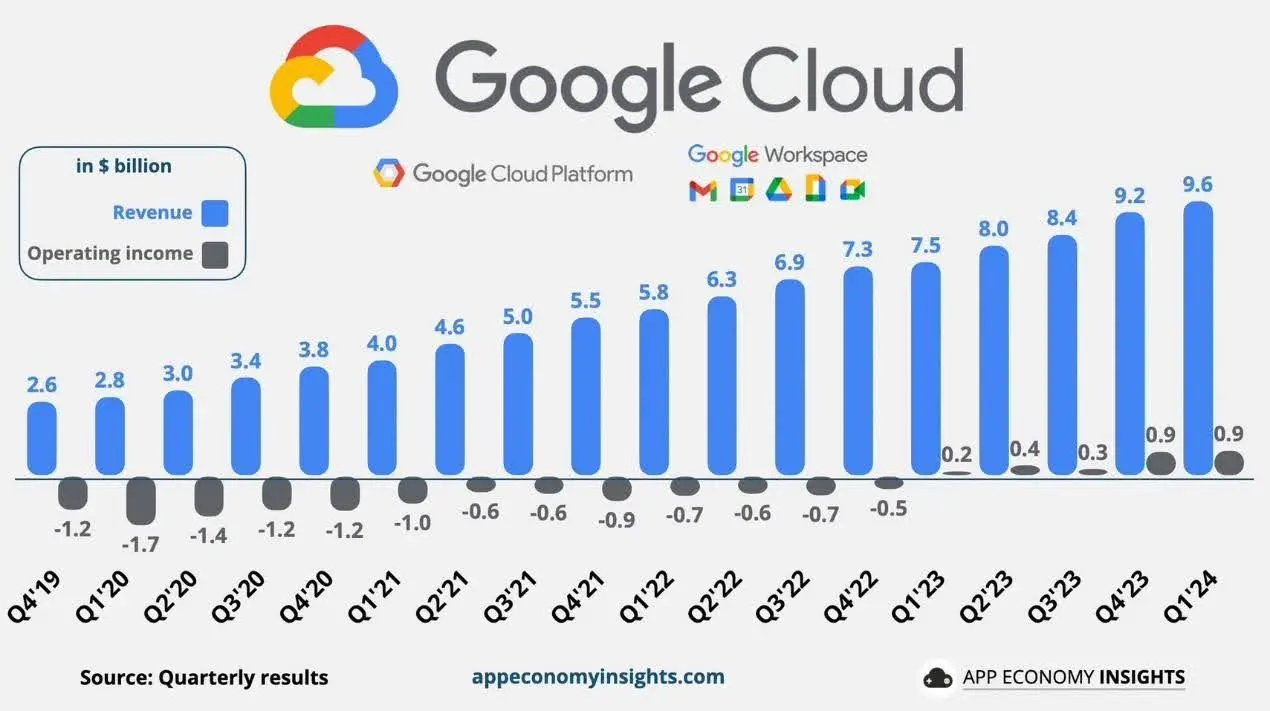
ALPHABET
Source: App Economy Insights
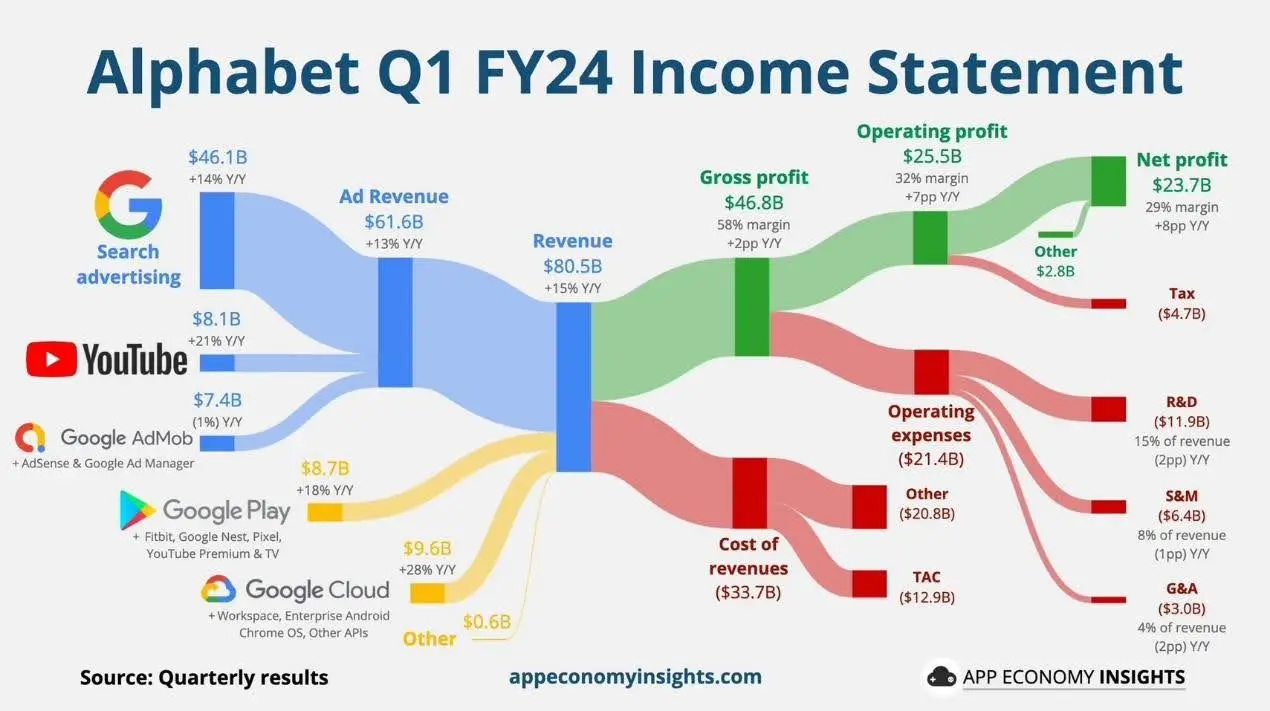
Fastest Revenue Growth: In the first quarter, total revenue reached $80.54 billion, a 15% year-over-year increase, marking the fastest growth rate in two years and exceeding market expectations.
Profit Surge: Adjusted EPS was $1.89, a 61.5% increase year-over-year. Net profit rose 57% to $23.66 billion, far exceeding market expectations.
Cloud Business Growth Acceleration: Cloud revenue grew by 28.4% year-over-year, with operating profit surging fourfold, showing outstanding performance.
Source: App Economy Insights
Advertising Revenue Steady Improvement: Core advertising business revenue increased by 13%, and YouTube ad revenue grew by nearly 21%, reflecting steady improvement in advertising revenue.
Artificial Intelligence (AI) Investment: Google invested $12 billion in AI research and development, accelerating AI application in its products.
Shareholder Returns: Google issued quarterly dividends for the first time and plans to repurchase up to $70 billion in stock.
Positive Factors:
- The Paris Olympics in 2024 and the U.S. presidential election will improve the advertising environment, boosting Google’s performance.
- Goldman Sachs noted that search business revenue is strong this year, and YouTube’s revenue is recovering. Jefferies remains optimistic about Google’s second-half performance, citing improved core advertising business and increased AI visibility.
Negative Factors:
- Increasing competition in AI could disrupt Google’s core search business.
- Tighter regulation in the U.S. and Europe poses challenges. Bernstein believes any mistake by Alphabet could be a wake-up call for AI.
- Investment bank Monness Crespi Hardt noted that while Google is well-positioned, it faces challenges from an unfavorable regulatory environment, intensified competition, and uneven internal execution.
Uncertainties:
- Speculation about new stock buyback authorization and the replacement of CFO Ruth Porat brings some uncertainty. (But the market is excited about stock buybacks so far.)
- Google announced a financial department reorganization last week to allocate more resources to the AI sector.
Outlook:
- As Google focuses on product speed and department reorganization in the AI era, layoffs will continue in the second quarter, but operating profits are expected to increase further.
- Capital expenditures for 2024 are estimated at $42 billion and may increase further to $46 billion next year.
INTEL
2024 First Quarter Financial Report (Below Expected Forecasts)
Performance:
- First-quarter operating revenue rose 9% year-over-year to $12.72 billion, matching expectations.
- First-quarter earnings per share (EPS) were $0.18, exceeding expectations.
- Gross margin reached 45.1%, higher than expected.
Guidance:
- Second-quarter revenue is expected to be between $12.5 billion and $13.5 billion, below expectations.
- Second-quarter adjusted EPS is forecasted to be $0.2, also below expectations.
- Second-quarter gross margin is expected to be 43.5%, lower than expected.
Business Integration and Adjustments:
- Intel has reorganized its business into two new divisions.
- First-quarter business performance: Data Center and AI revenue totaled $3 billion, Client Computing revenue reached $7.5 billion, and the gross profit margin was 45.1%.
CEO Outlook:
- CEO Pat Gelsinger is confident about the company’s future, expecting continuous growth throughout the year.
- The Gaudi AI chip product line is projected to generate over $500 million in revenue this year.
Technological Innovation:
- Intel introduced a new generation of AI chips, Gaudi 3, which performs better than competitor NVIDIA’s H100.
AMAZON
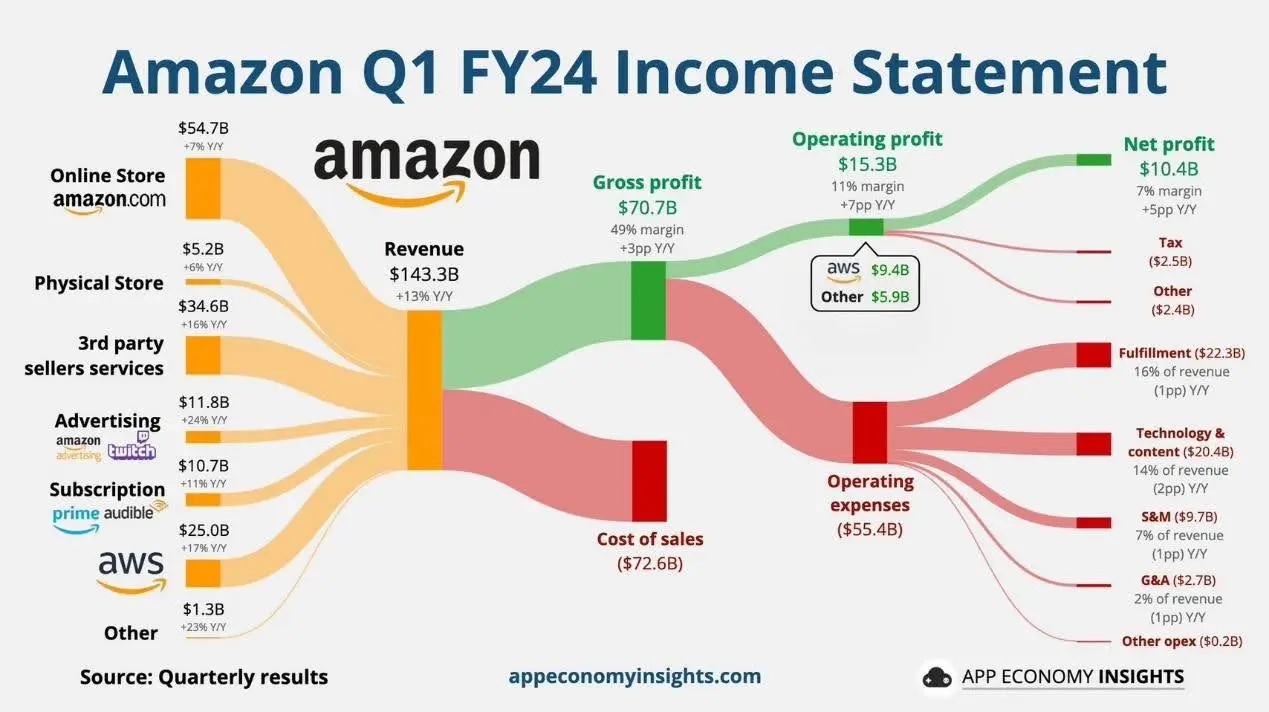
Source: App Economy Insights
Amazon exceeded market expectations in Q1 profit and revenue, driven mainly by strong growth in advertising and cloud computing. Q2 profits are expected to continue rising.
- Q1 EPS: $0.98, higher than the expected $0.83.
- Q1 Revenue: $143.3 billion, up 13% year-over-year, exceeding the expected $142.5 billion.
The Amazon Web Services (AWS) division was particularly strong, with revenue up 17% to $25 billion, surpassing market expectations.
Q1 Financial Data
- EPS: $0.98 (vs. $0.83 expected)
- Revenue: Up 13% to $143.3 billion (vs. $142.5 billion expected)
- Operating Profit: Soared by 200% to $15.3 billion
Q2 Forecasts
- Revenue: $144-149 billion, up 7-11%
- Operating Profit: $10-14 billion (compared to $7.7 billion last year)
- AWS Revenue: Up 17% to $25 billion (vs. $24.5 billion expected)
- Advertising Revenue: Up 24% to $11.8 billion (vs. $11.7 billion expected)
Operating profit growth far outpaced revenue growth, highlighting the success of Amazon’s cost control and efficiency improvement strategies (layoffs were effective).
Other Notable Data
- Revenue from third-party seller services grew significantly, up 16% year-over-year to $34.5 billion.
- AWS accounted for 62% of total operating profit, with net profit tripling from $3.17 billion (or $0.31 per share) last year to $10.4 billion (or $0.98 per share).
- Amazon’s advertising sales jumped 24%, slightly exceeding market expectations.
This is the first financial report since Amazon began advertising on Prime Video.
AMD
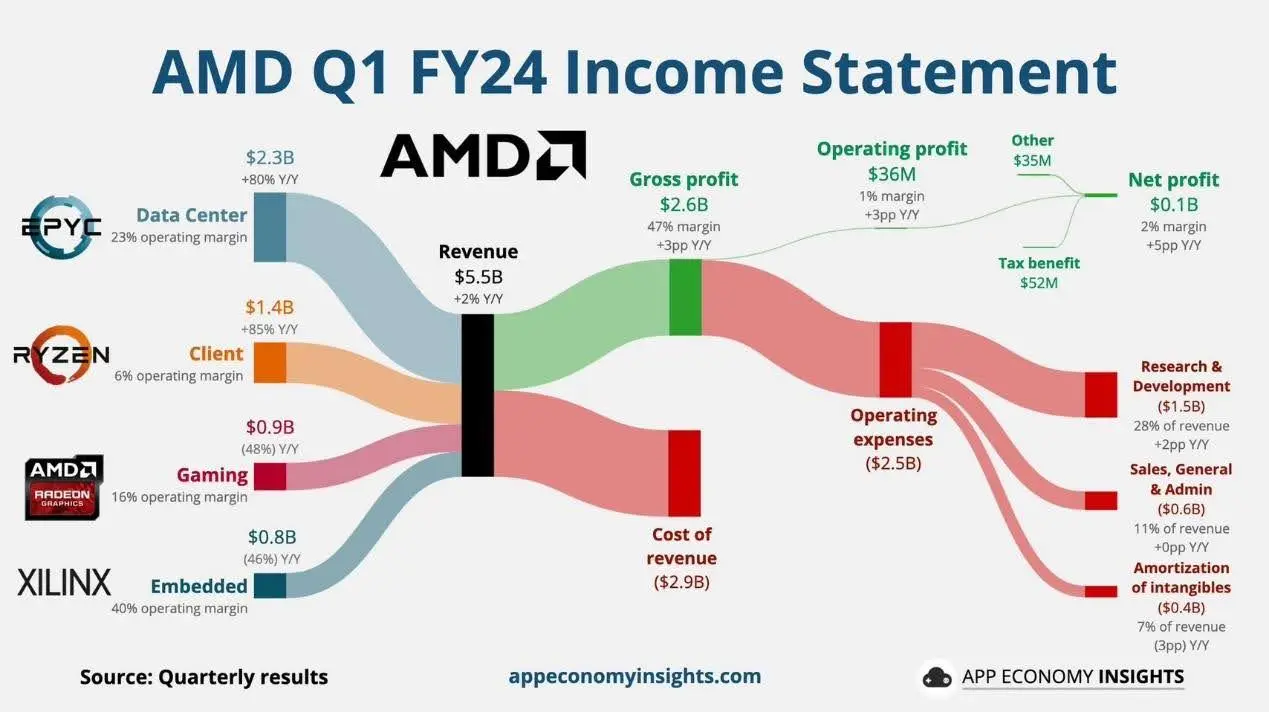
Source: App Economy Insights
In the past quarter, AMD’s revenue slightly exceeded expectations, but post-market share prices fell more than 8% due to weak gaming console chip demand. While the company raised its annual forecast for AI chip sales, it still fell short of Wall Street’s high expectations.
CEO Lisa Su Emphasizes:
- Strong performance in the data center and client markets was driven by the MI300 AI accelerator and fourth-generation EPYC processor.
2024 Forecasts:
- The company predicts AI chip sales will reach $4 billion, higher than the previous $3.5 billion estimate.
- However, the gaming segment remains weak, with a significant decline in revenue.
- The embedded segment also saw revenue decline due to customer inventory management.
Key Figures:
- Total revenue reached $5.7 billion, up 6% year-over-year, in line with expectations.
- Gaming division revenue fell by 48%, representing the weakest performance.
- Embedded division revenue dropped by 46% due to inventory management issues.
MI300X Chip:
- Adopted by major tech companies, this chip has already achieved over $1 billion in sales.
APPLE
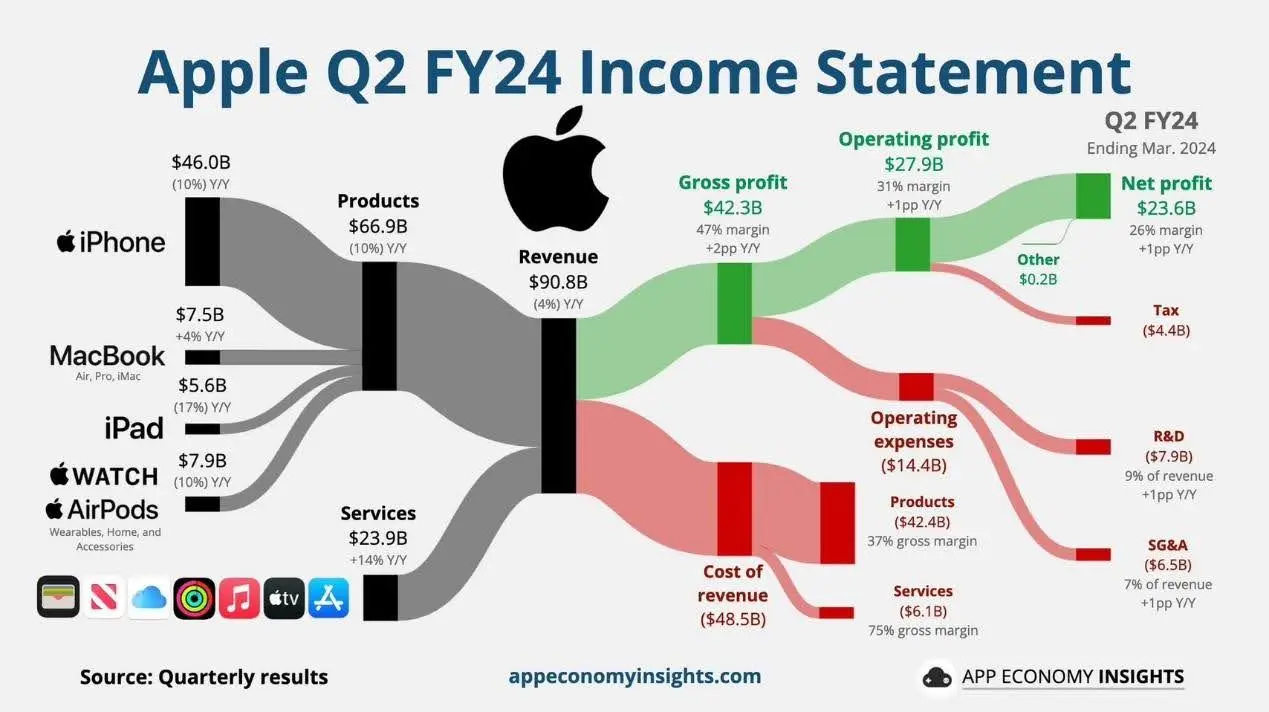
Source: App Economy Insights
In the second quarter of fiscal 2024, Apple’s revenue declined, but the decrease was smaller than expected, and the company expects growth to resume this quarter.
Revenue Details:
- iPhone Revenue: Fell 10% to $45.96 billion.
- Mac Revenue: Unexpectedly rose 4% to $7.45 billion, driven by the release of the new MacBook Air.
- Services Revenue: Increased 14% to $23.9 billion, mainly benefiting from the App Store.
Despite an 8% decline in Greater China sales, the results were still better than expected. CFO Luca Maestri noted that concerns about the Chinese market have been overstated and that this quarter’s revenue is expected to grow by a low single-digit percentage.
Share Buyback Plan:
- Apple announced the largest stock repurchase plan in its history, buying back up to $110 billion in shares, demonstrating its commitment to shareholder returns.
Overall Financial Report:
- Revenue declined 4.3% year-over-year to $90.75 billion, better than expected.
- EPS was $1.53 per share, a record high for this quarter.
- Apple also raised its quarterly dividend for the 12th consecutive year.
Key Observations:
- iPhone sales fell 10.5% year-over-year.
- Services revenue set a record for the fifth consecutive quarter, growing 14.2%.
- Greater China revenue decreased by 8.1%, better than the expected double-digit percentage decline.
CEO Tim Cook Hints:
- New iPads will be released next week, and significant AI announcements will be made at the June Worldwide Developers Conference.
Market Focus:
- There is a strong focus on Apple’s AI strategy, as AI could boost iPhone sales and trigger an upgrade cycle.
- Analysts are generally optimistic about Apple’s potential benefits in AI and new product releases later in the year, but opinions are divided on whether the iPhone 16 will significantly increase sales.
STOCK PRICE BASE EFFECTS

Although everyone currently views Tesla as a “junk car,” and the U.S. Big Seven tech giants have become six, the author wants to explain to readers that the main reason for compiling the aforementioned financial data is to share the concept of base effects. Recall the American companies that led the financial reports: except for Tesla, the others exceeded market expectations and performed well. Yet, some of these companies saw their stock prices take a beating, while Tesla, despite having a disastrous report, saw its stock rise. Why is this? There are two points worth discussing here.
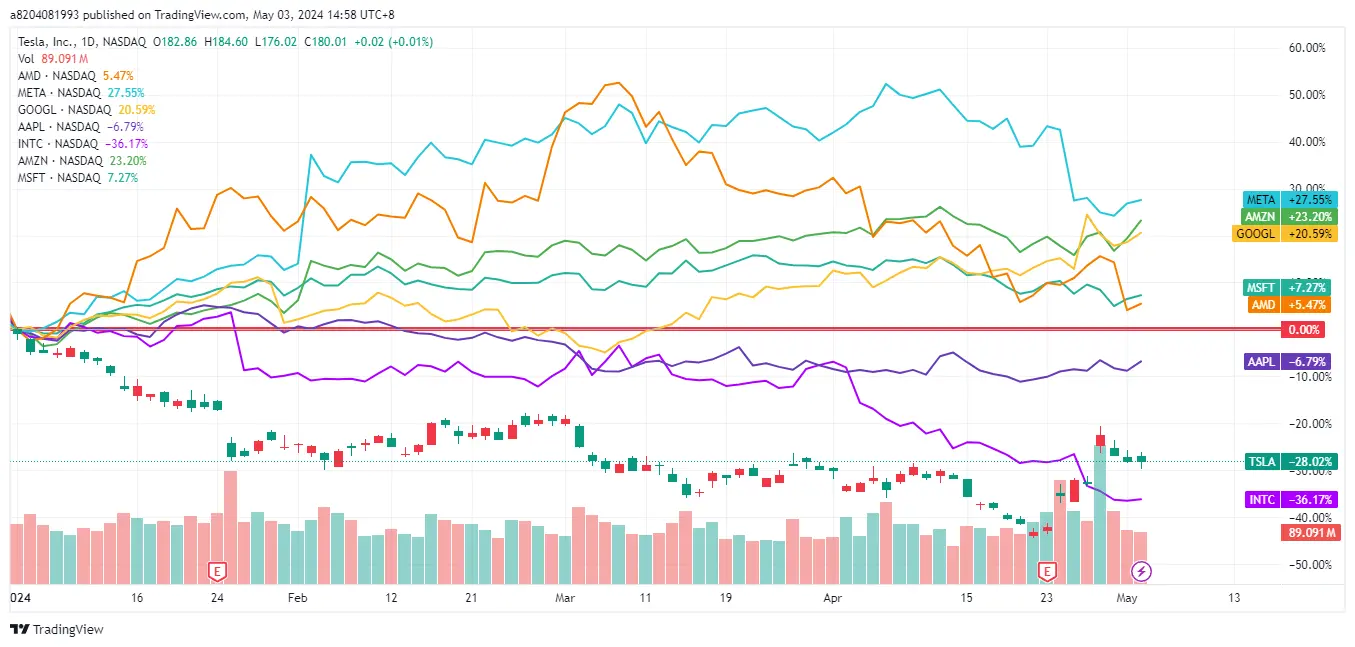
Source: TradingView
First, let’s look at the stock prices of the companies mentioned. We find almost a dichotomy: most companies that exceeded expectations saw their stock prices drop, while Tesla, which had been falling since the beginning of the year, rebounded upon releasing its financial report. This reflects not only the differences in expectations based on previous stock price bases but also introduces an important concept of “financial forecasting.”
FINANCIAL FORECASTING: KEY TO FUTURE PROFITS
It is important to understand that the market always looks forward, and stock prices typically reflect the future performance of a company. As artificial intelligence becomes a global focus, the outlook on AI capital expenditures becomes equally important. For instance, when TSMC announced a reduction in semiconductor production capacity and weaker-than-expected demand, the market didn’t care if a company was making NT$100 million an hour—it sent the stock prices plummeting.
However, this time Tesla was different. The market was abuzz with rumors that new car models were scrapped, and Elon Musk was fully committing to the RoboTaxi initiative. Everyone was taken aback: “Is this true?” But then, Tesla’s executives quickly clarified that not only would they continue with the RoboTaxi, but the Model Two was not canceled. They even moved up the timeline, with the new model possibly launching by the end of 2024 or early 2025, reigniting market anticipation for Tesla.
Do readers remember when, before the release of the Model Y in 2019-2020, Tesla faced a slump in market share? It was only after the Model Y was officially launched that Tesla’s market share soared again. The current market stimulation for Tesla’s stock price might be influenced by this scenario. When the new model officially goes on sale, it could again stimulate consumer purchases, especially since this time the price will be more affordable and appealing to the general public.
In conclusion, the author wants to express two points regarding the base effect:
1. The base effect is not only applicable to financial numbers but also has a deeper psychological significance in the market.
2. Financial forecasts can sometimes be more important than financial reports because the market always looks forward.