


KEYTAKEAWAYS
-
Crypto trading signals provide objective criteria for making informed buy and sell decisions, enhancing investment accuracy and success rates.
-
Understanding indicators like candlestick charts, moving averages, and trading volumes helps investors analyze market trends and strategies effectively.
-
Utilizing these signals allows investors to trade confidently, maintaining an advantage amidst cryptocurrency market fluctuations.
CONTENT
In this article, you can learn the importance of crypto trading signals to enhance your investment strategy. Also discover key indicators like candlestick charts, moving averages, and trading volumes for better market analysis.
WHY SHOULD WE LEARN CRYPTO TRADING SIGNALS?
Whether you are a newcomer to the cryptocurrency investment market or an experienced investor, you have likely searched online for advice on buying or selling prices and timings for cryptocurrencies. You might have even joined cryptocurrency trading groups, discussing investment targets and related trading ideas with other investors. In all these scenarios, the focus often revolves around crypto trading signals—objective criteria that investors use to make buy or sell decisions.
As cryptocurrency market investors, we aim to analyze various data to determine the best trading opportunities. In this article, we will start by discussing what crypto trading signals are and provide three indicators that can provide crypto trading signals, helping you make more confident and successful trades in the future.
3 MARKET INDICATORS PROVIDING CRYPTO TRADING SIGNALS
Trading signals are indicators based on various data analyses that determine the buying and selling timing and strategies for a particular investment target. Regarding crypto trading signals, the following indicators can be used for judgment:
1. Candlestick Chart
In the cryptocurrency market, a candlestick chart records the price changes of a cryptocurrency over a period. Because it resembles a candle, it is also known as a candlestick chart.
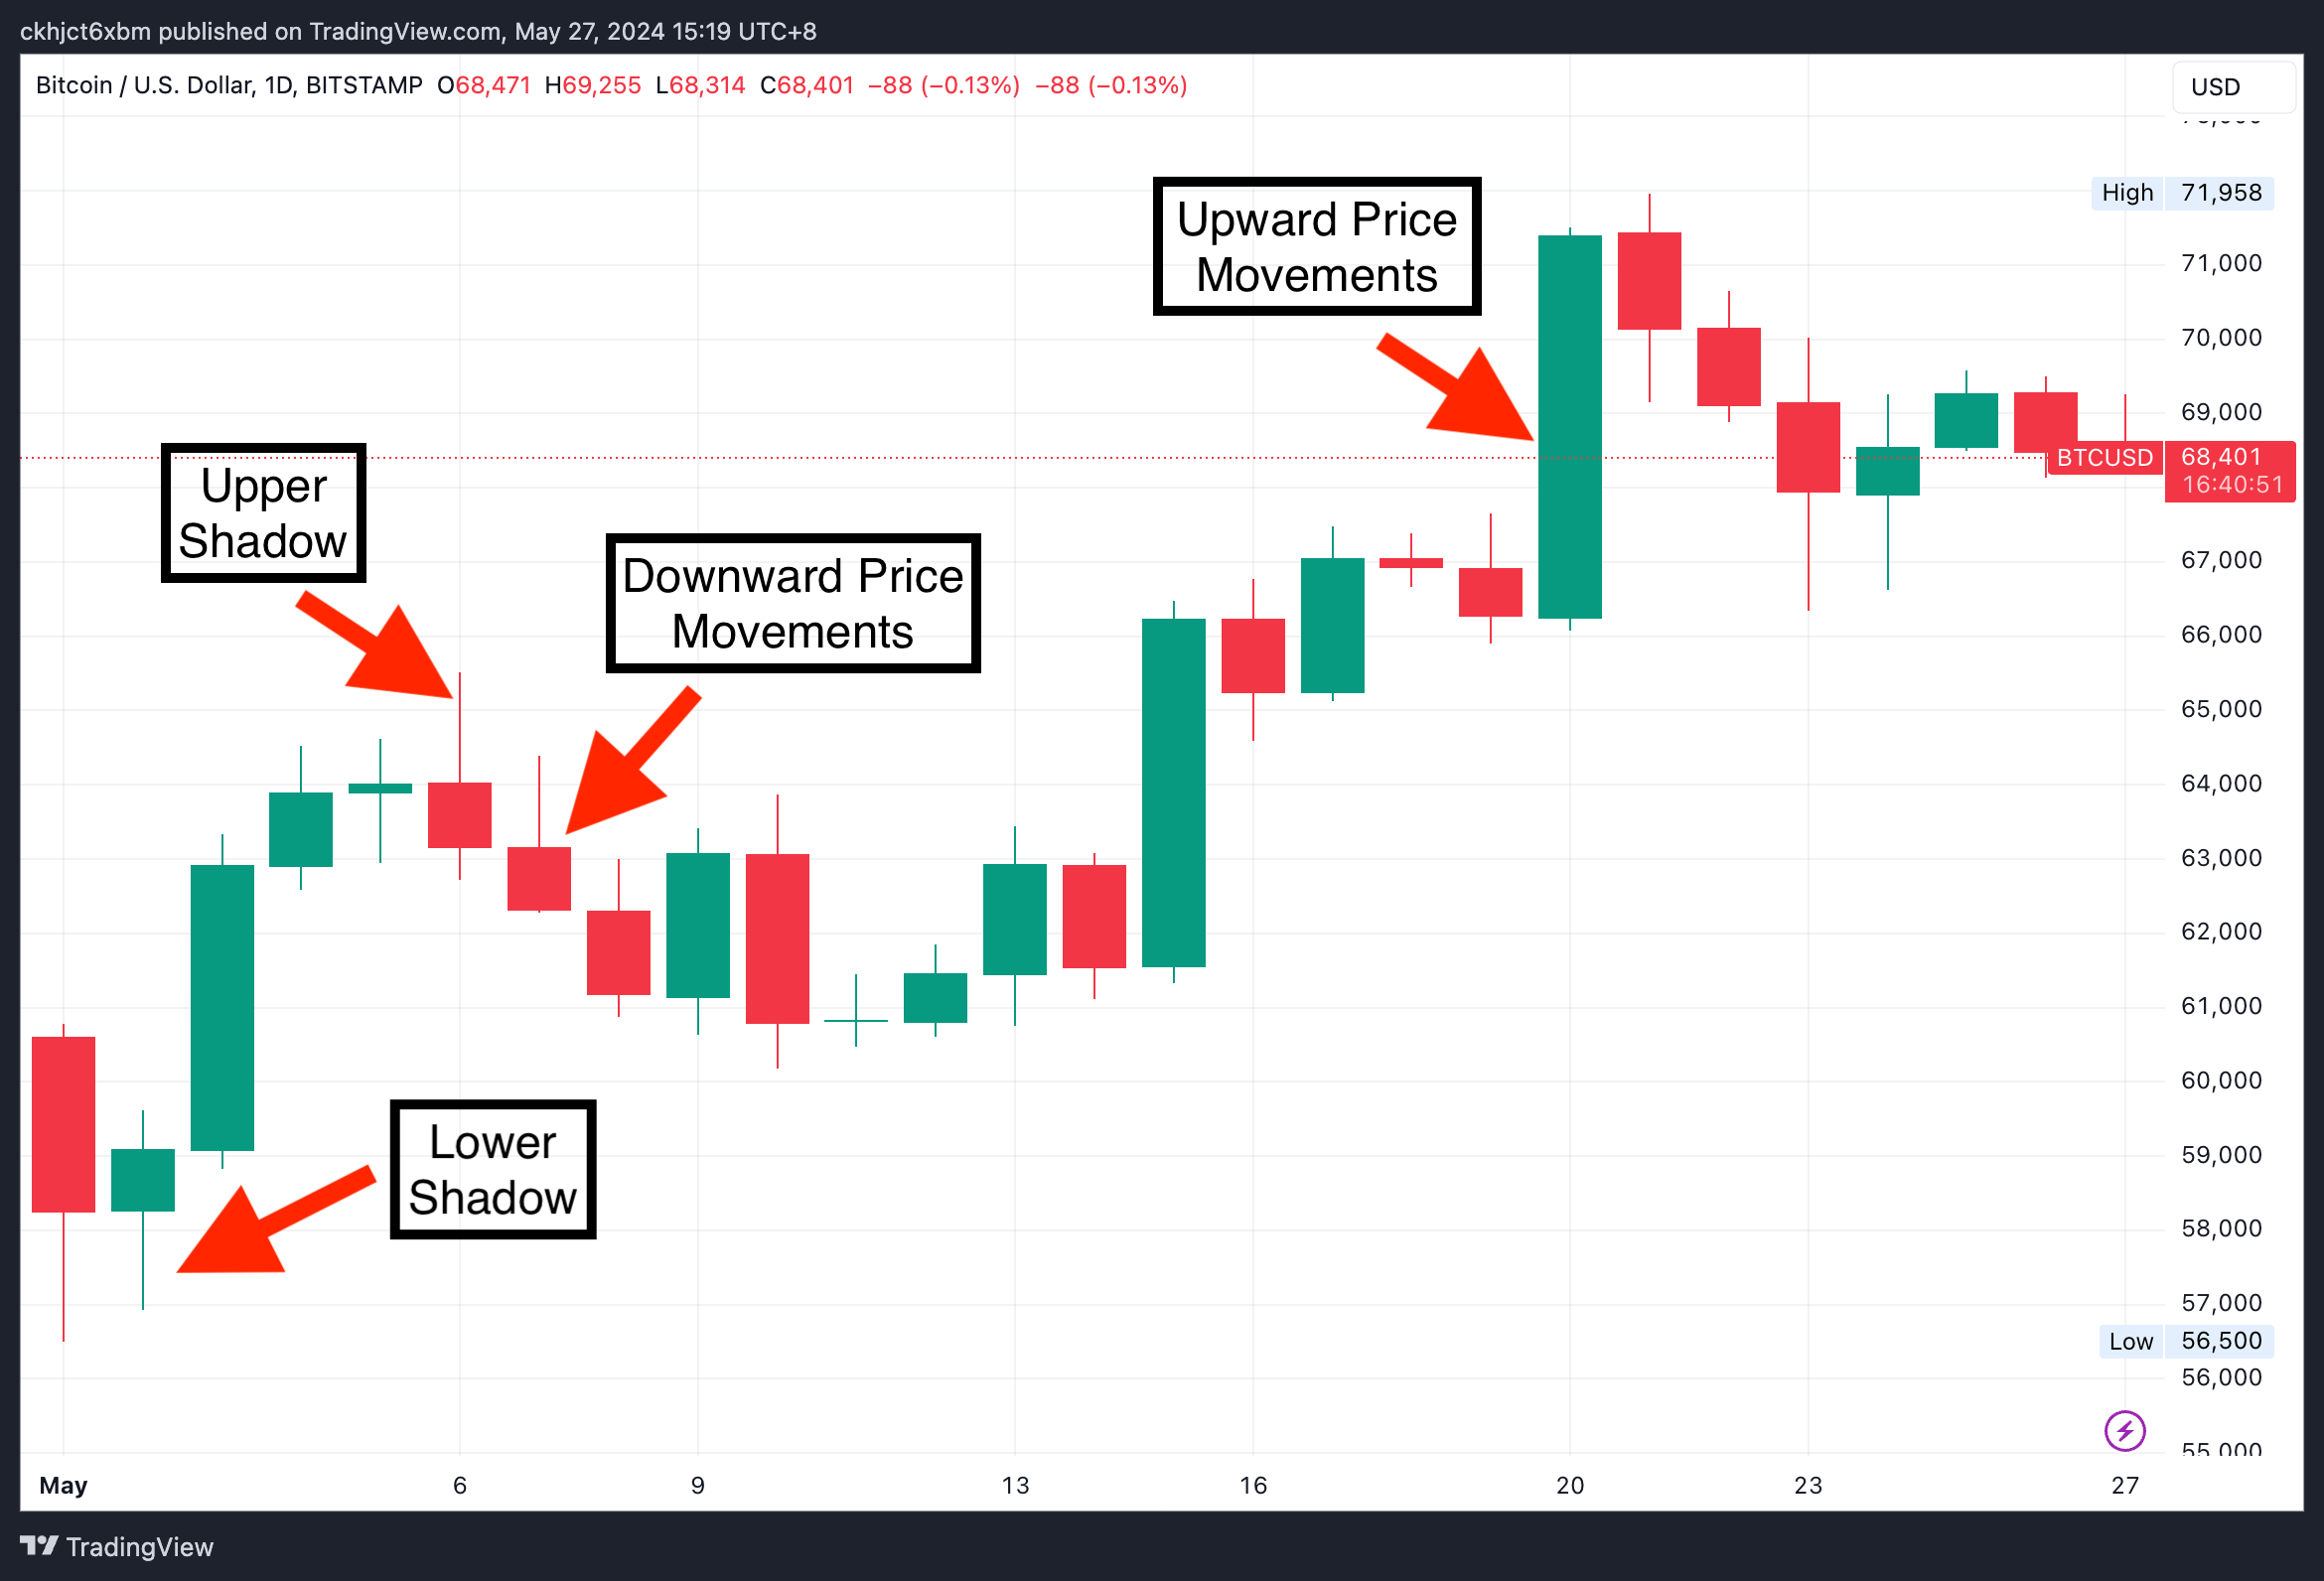
- In a candlestick chart, a green candlestick represents a price increase, and a red candlestick represents a price decrease.
- The highest price during the day’s rise and fall is called the upper shadow, and the lowest price is called the lower shadow.
Based on the time interval, candlestick charts can be divided into daily, weekly, monthly, and yearly charts.
- Daily candlestick chart: Covers the opening, closing, highest, and lowest prices of a cryptocurrency within a day (24 hours). It uses 23:59:59 UTC as the interval. A daily candlestick chart is useful for mid-term traders or long-term investors to regularly review and analyze mid-term market trends and possible support and resistance points.
- Weekly candlestick chart: Covers the opening, closing, highest, and lowest prices of a cryptocurrency within a week (7 days), using every Sunday at 23:59:59 UTC as the interval. A weekly candlestick chart is suitable for long-term investors studying long-term trends and market structures.
- Monthly candlestick chart: Covers the opening, closing, highest, and lowest prices of a cryptocurrency within a month, using the last day of the month at 23:59:59 UTC as the interval.
- Yearly candlestick chart: Covers the opening, closing, highest, and lowest prices of a cryptocurrency within a year.
*Besides the types of candlestick charts mentioned above, some short-term investors might even focus on the hourly candlestick chart or 15-minute candlestick chart, but the concept remains the same, differing only in time intervals.
Below, we use Bitcoin‘s daily candlestick chart to introduce readers to the upper shadow, lower shadow, and several common candlestick chart patterns:
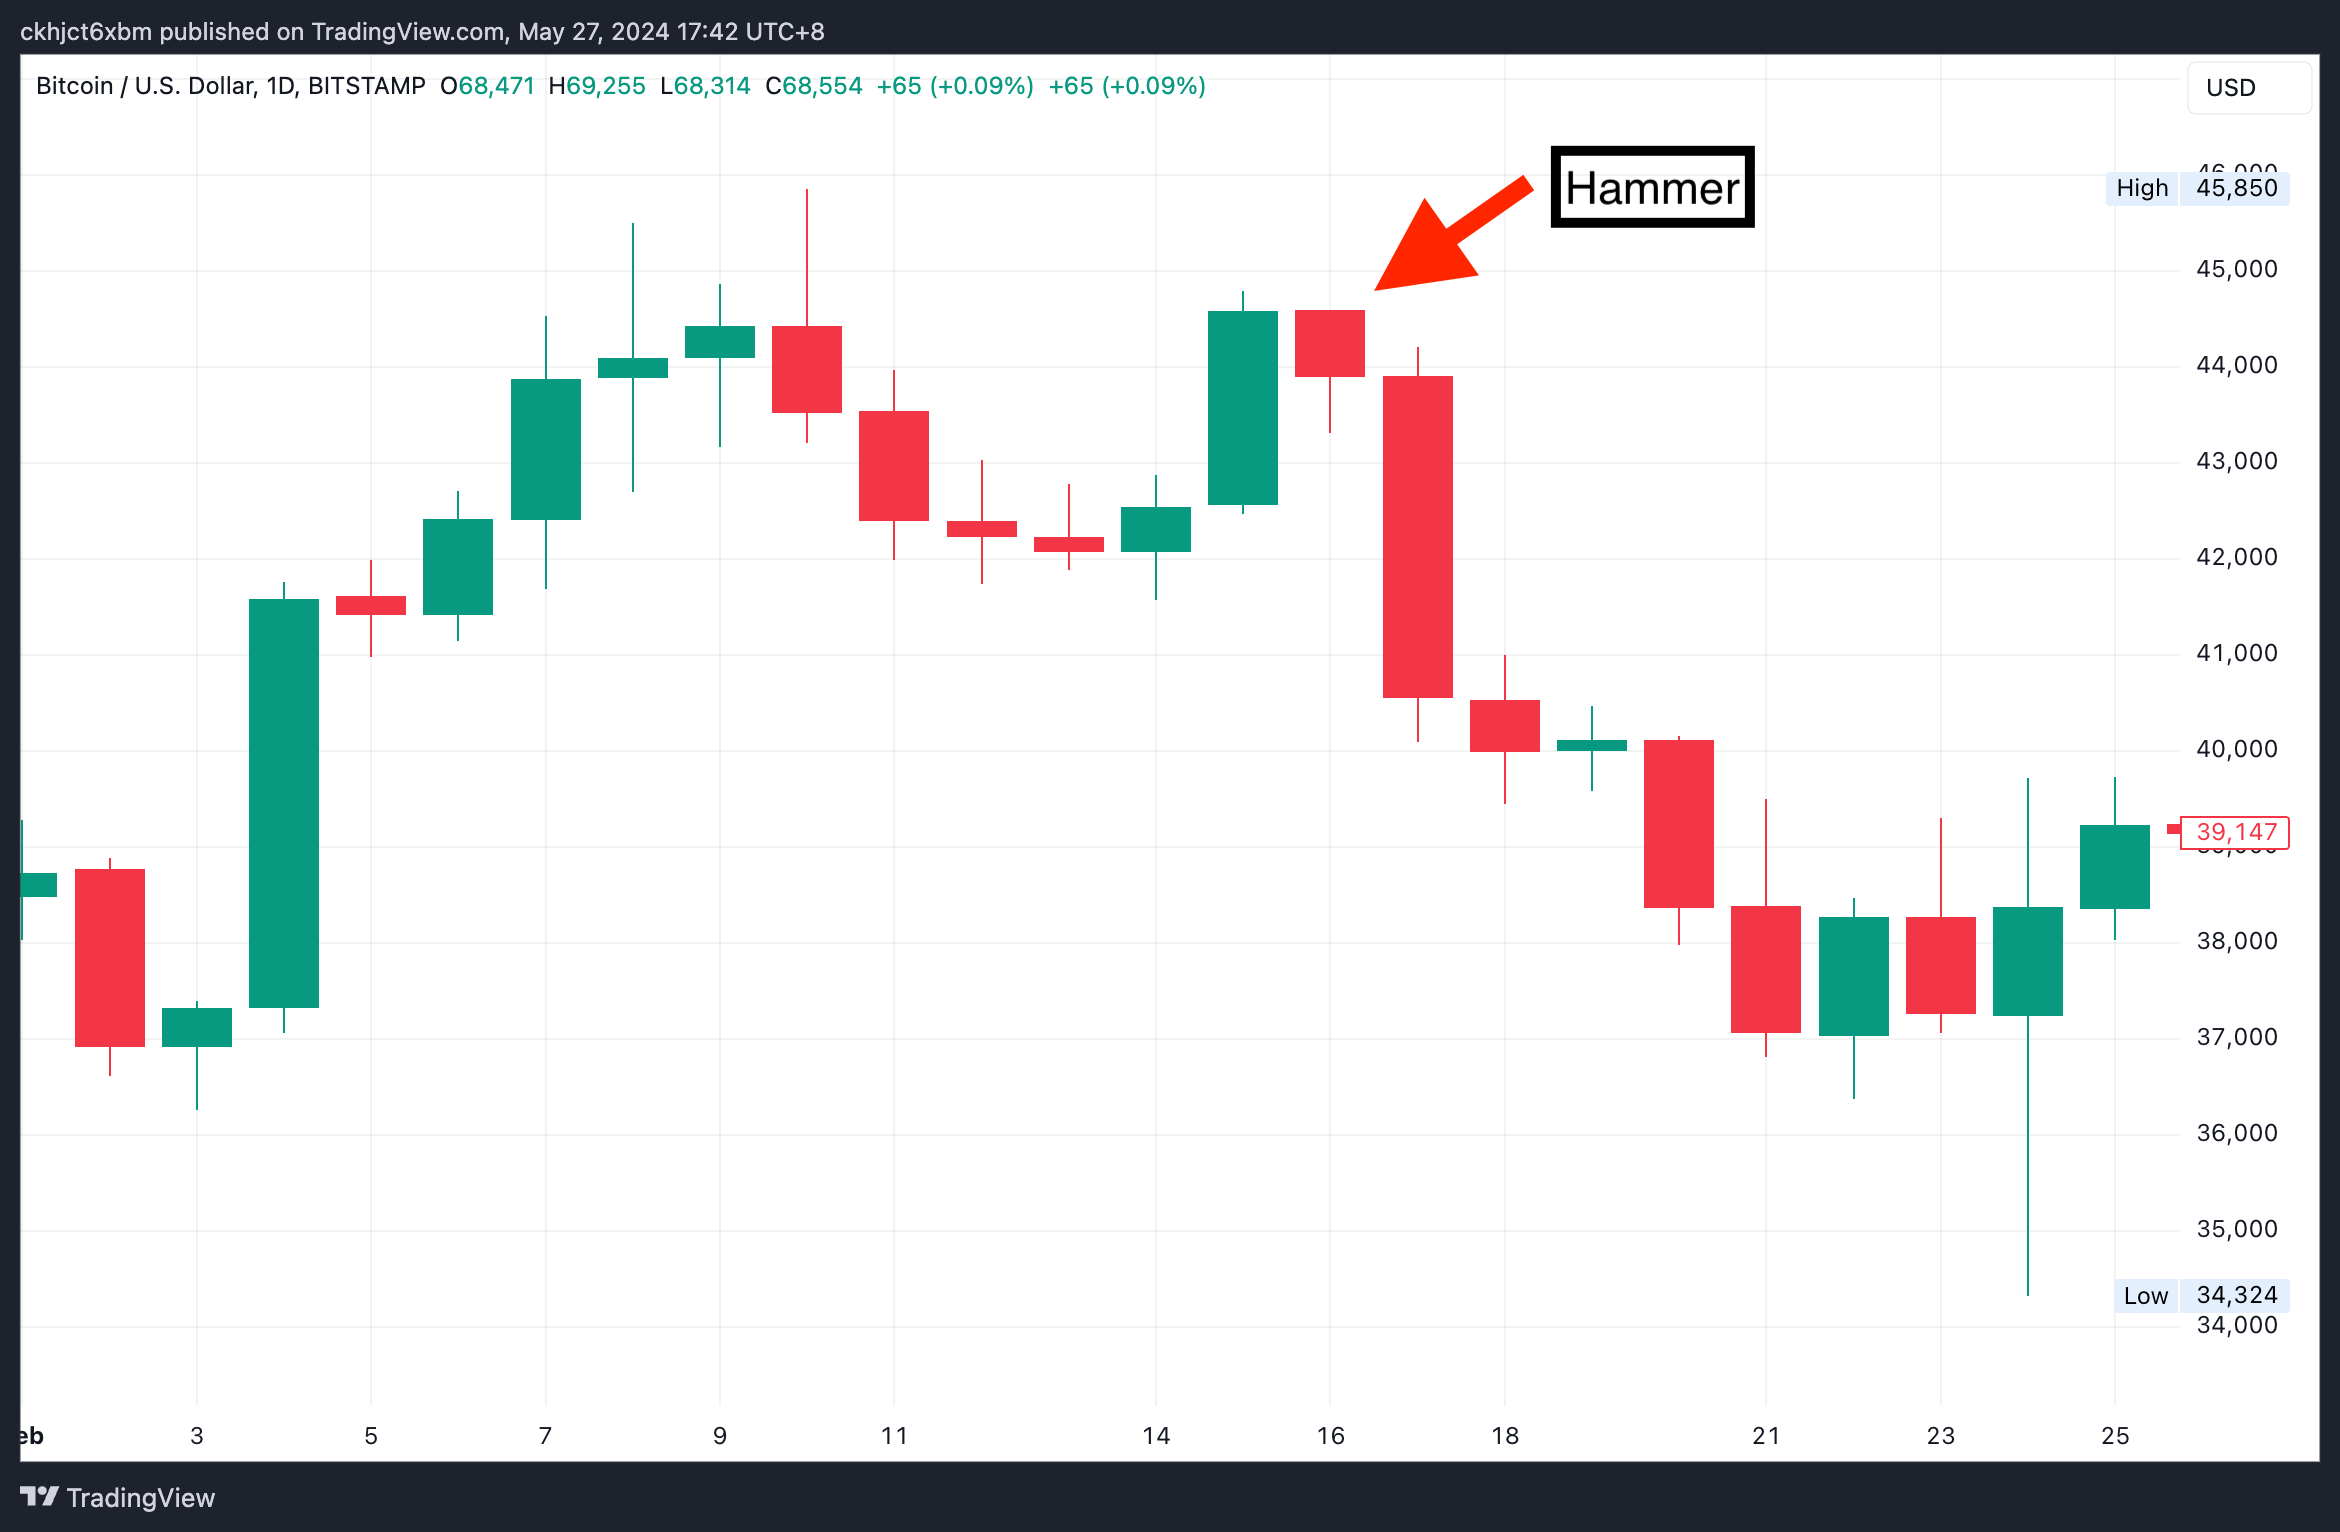
- Hammer: After the opening, sellers significantly sell off the cryptocurrency, leading to a price drop, but subsequent heavy buying pressure in the market absorbs the selling pressure, and the price is pushed up again, although it does not surpass the opening price. This bearish pattern suggests that buying pressure has accumulated over a period and could be seen as a strong support signal at the bottom.
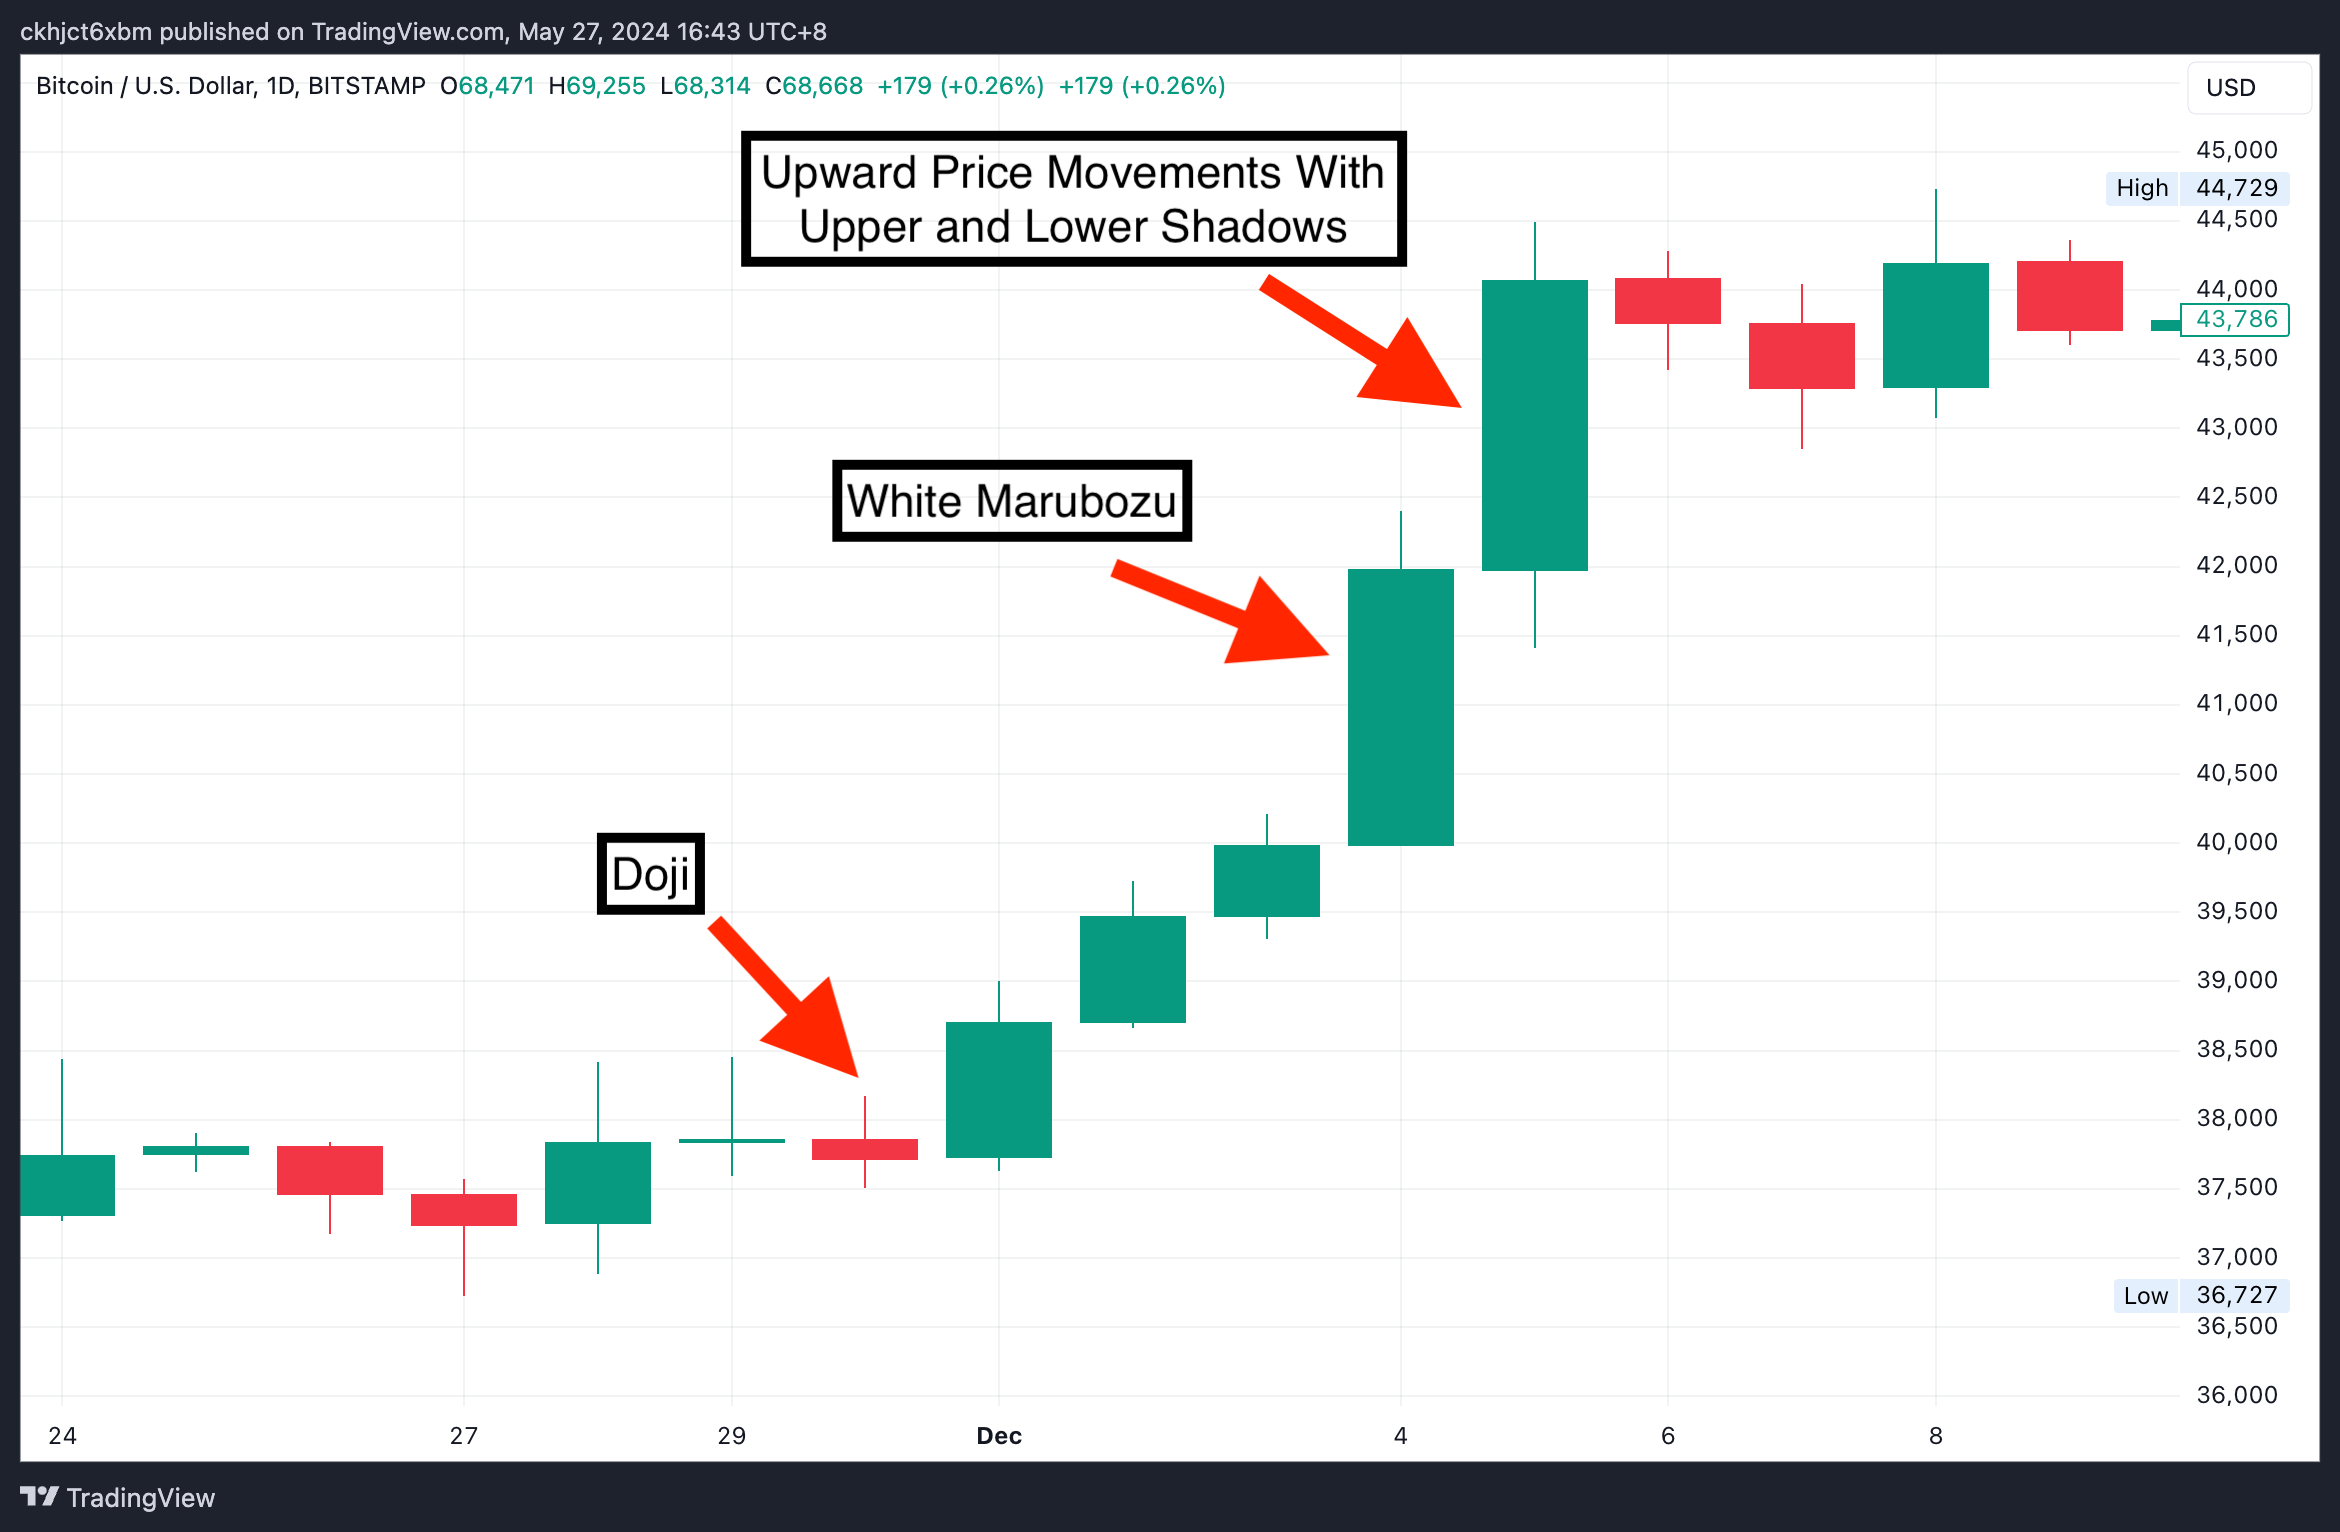
- Doji: Indicates a balance between buying and selling pressures, often a precursor to price reversal or consolidation. If the upper and lower shadows are long, it suggests intense competition between buyers and sellers, indicating possible future changes. Conversely, short shadows suggest potential consolidation. Such a candlestick pattern, if it appears at a recent high point in the trend, indicates a weakening buying power, suggesting a potential price decline for the cryptocurrency. Conversely, if this pattern appears at a recent low point in the trend, it indicates a weakening selling pressure, suggesting a potential price increase for the cryptocurrency. If this candlestick pattern appears during a consolidation phase, it signifies that the buying and selling forces are still evenly matched, requiring close attention to future developments.
- White Opening Bozu: Strong bullish action from the opening, encountering selling resistance at high levels, but the closing price remains higher than the opening price. This bullish pattern indicates uncertain future trends and requires monitoring the length of the red body and the upper shadow.
- Upward Price Movements with Upper and Lower Shadows: After a price drop post-opening, buying support pushes the price up, leading to a higher closing price, indicating intense competition between buyers and sellers during the session. If this bullish pattern appears after a significant rise, it could signal a reversal. If it appears after a significant drop, it could indicate a bottom.
The moving average is calculated based on the average price of a cryptocurrency over different days to determine subsequent investment strategies. It can be considered an important crypto trading signal.
- Typically, the days used for moving averages include 10, 20, 50, 100, and even 200 days.
- A 200-day moving average is considered a support level in an uptrend and a resistance level in a downtrend.
- In the cryptocurrency market, special attention is given to the 50-day and 200-day moving averages. Generally, when the 50-day moving average is below the 200-day moving average, it forms the so-called death cross, indicating an impending price drop. Conversely, when the 50-day moving average surpasses the 200-day moving average, it indicates a price increase.
3. Trading Volume
Volume is another factor used to determine crypto trading signals. If the trading volume of a cryptocurrency gradually increases, its price is likely to rise. Conversely, if the trading volume shows a declining trend, the price may drop.
- If the trading volume of a cryptocurrency suddenly becomes more active than the usual average, significant price volatility can be expected.
- On the other hand, if the trading volume is lower than the usual average, price fluctuations will be more stable, with less volatility.
CONCLUSION
Whether you are a novice or an experienced investor, understanding and utilizing crypto trading signals can enhance the success rate and accuracy of your trades. In the cryptocurrency market, trading signals provide an objective basis for buy and sell decisions, helping us better grasp market dynamics. This article introduces three key crypto trading signal indicators to help investors better understand market trends and make more informed investment decisions.
By mastering these signals, investors can trade with more confidence and maintain an advantage amidst market fluctuations. We hope the knowledge provided in this article helps you achieve better results in your cryptocurrency trading endeavors.
FAQS
- Why should we learn crypto trading signals?
Because crypto trading signals are objective criteria that investors use to make buy or sell decisions, and will help you make more confident and successful trades in the future.
- What are 3 market indicators providing crypto trading signals?
candlestick chart, Moving Average(MA), and Trading Volume are 3 of market indicators providing crypto trading signals.
More articles about the crypto trading:
-
Crypto Futures Trading: A Way to Multiply Your Crypto Returns
-
Understanding Automated Crypto Trading at a Glance and How to Optimize Your Investment by It
▶ Buy Crypto at Bitget
CoinRank x Bitget – Sign up & Trade to get $20!